SHARE


SaleCycle explores some of the busiest retail months online, the best ecommerce online shopper marketing statistics including UK retail sector statistics and the ecommerce market size.
In this article we go deep into some of the research from the 2022 Ecommerce Stats & Trends Report. We draw a spotlight on 11 of the best but if you want further insights and context around these numbers and many more don’t hesitate to download our Free 2022 Ecommerce Stats & Trends Report. We explore fashion ecommerce industry statistics, as well as retail and travel.
SaleCycle Ecommerce Statistical Data
- Each day we track the behaviour behind more than three million online purchases and abandonments.
- Our data is backed by real-world online conversions and customer journeys from over 500 of the world’s biggest brands.
What Are Ecommerce Statistics & Trends & How Are They Useful:
Ecommerce statistical data is data and trends gathered from tracking the online consumer journey on websites in different industries. This provides businesses with essential information about their website, products and consumers.
- Using up-to-date ecommerce stats and trends enables you to benchmark your KPIs against an industry and market-specific standard.
- Keep on top of market trends and discover new market insights within the data to discover new business marketing opportunities
- Use data-driven tips and solutions to solve your business issues
- Get a 360 view on customer behaviour in your industry. When do customers buy, when do customers show more intent, when is cart abandonment low, how does traffic ebb and flow. Mine customer behaviour metrics like sales by hour to improve your promotional strategy and increase conversion rates.
11 Important 2022/23 Ecommerce Stats & Trends
Ecommerce Online Sales Statistics
Mobile Ecommerce Online Sales
Mobile accounted for just over 55% of online sales in 2022.

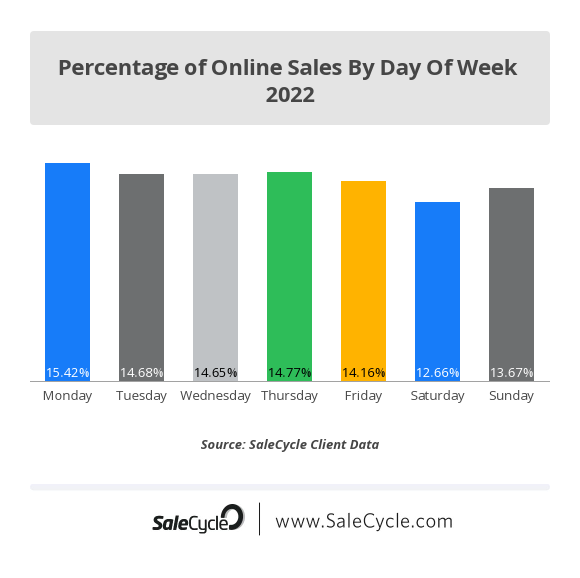
Best Day For Online Sales
In recent years Thursday has been the most popular day for online sales. However, our data from 2021 until now in 2023, reveals that Monday saw the highest volume of online sales. This suggests a definite shift in consumer behaviour.
Ecommerce Cart Abandonment Trends
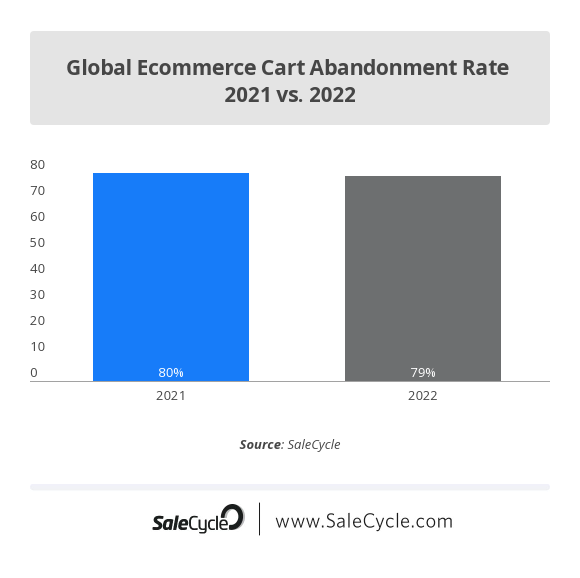
Average Global Ecommerce Cart Abandonment Rate
The total cart abandonment rate for 2022 is 79.53% compared to 80.68% in 2021. This is a significant drop in abandonment rates, which is a positive outlook for online clients.
Global Cart Abandonment Rate by Device
Mobile has a higher shopping cart abandonment rate than desktop. However, mobile has significantly more online sessions than desktop. The gap between abandonments between the two devices compared to the gap in online traffic suggest there’s a lot of value and opportunity within mobile ecommerce. This data can be used to benchmark your checkout abandonment in 2023.
- Mobile 83.76%
- Desktop 75.65%
Ecommerce Online Traffic Insights
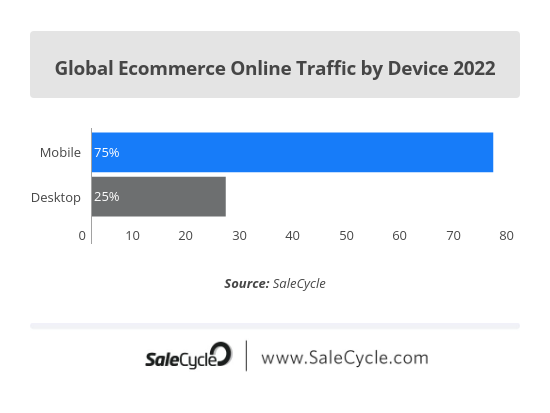
Total Online Traffic Insights by Device
Mobile traffic is much higher than desktop traffic, which stands at 25%. Mobile traffic has also grown by a significant 3.77% in 12 months (since 2021) to 75%. This, however, doesn’t necessarily mean that online sales and mobile AOVs are higher than desktop sales. Brands can always work towards better mobile conversion rates in an ever expanding m-commerce world.
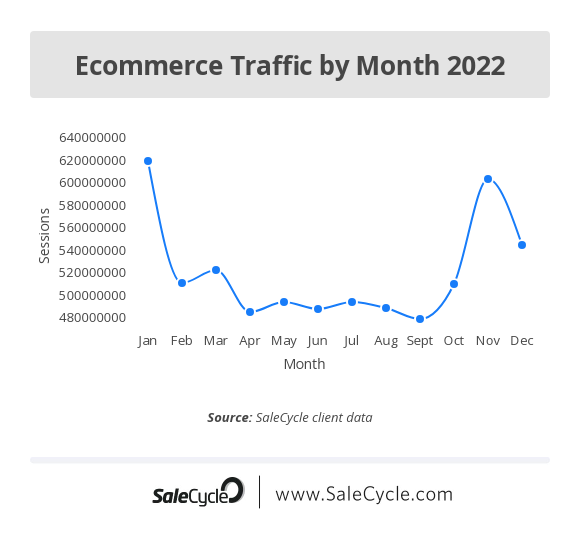
Online Traffic Data by Month
Our latest global ecommerce data found January has the highest amount of online traffic throughout the year. This is a major change, as the month of November has held the most amount of sales for many years thanks to the Black Friday, Cyber Monday and Christmas effect.
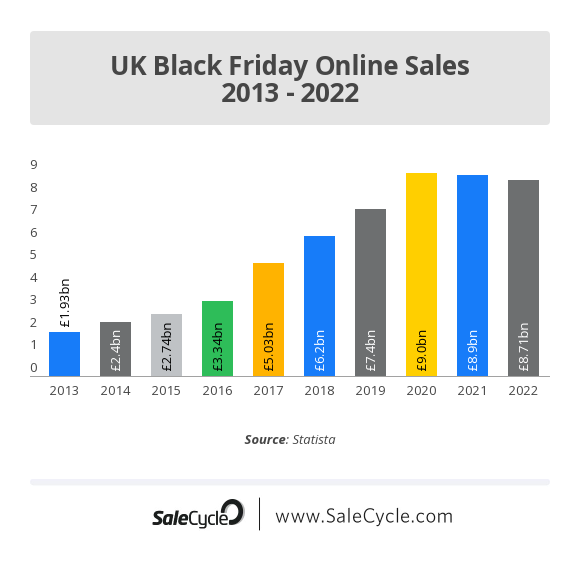
Black Friday Ecommerce Statistics
Black Friday sales have continued to slowly decline since the highest grossing year for online sales in 2020 – from 9 billion to 8.71 billion in 2022.
Email Marketing
In 2022 we sent a total of 120,061,371 emails for over 500 of the world’s biggest brands. Here’s the email marketing results we found over the past 12 months.
- Average Open Rate: 50.02%
- Average Click Rate: 18.72%
- Average Conversion Rate: 27.45%
SaleCycle explores some of the busiest retail months online, the best ecommerce online shopper marketing statistics including UK retail sector statistics and the ecommerce market size.
In this article we go deep into some of the research from the 2021 Ecommerce Stats & Trends Report. We draw a spotlight on 11 of the best but if you want further insights and context around these numbers and many more don’t hesitate to download our free 2021 Ecommerce Stats & Trends Report.
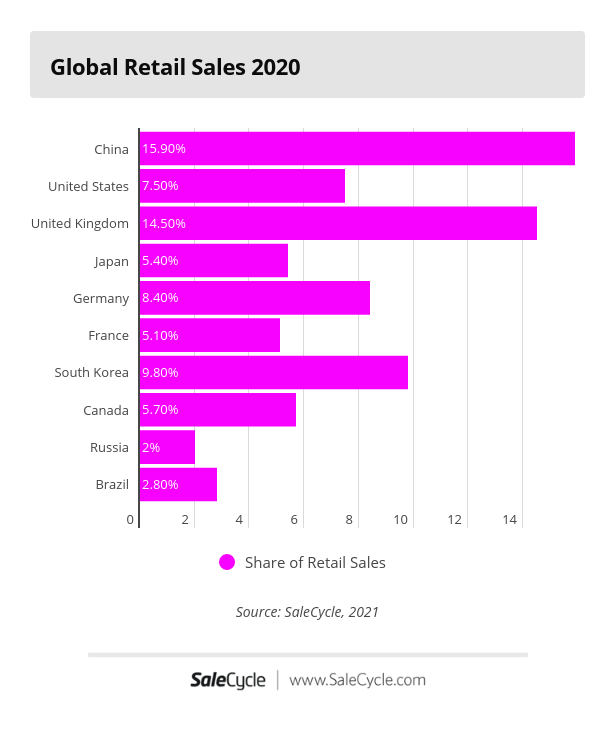
Top 10 Ecommerce Markets
Asia has become the most valuable ecommerce market in the world, with China rapidly growing year on year. We also see online shopping statistics in the UK are in the top 5 most valuable markets in the world. Of course, the UK ecommerce market is one of the most mature.
We can also see exciting markets like South Korea and Japan in the top 10 who are commanding a nice piece of the ecommerce pie. We also see Brazil entering the top 10, the only South American country at this time. Brazil is attracting heavy interest from international companies and executives, especially those from North America.
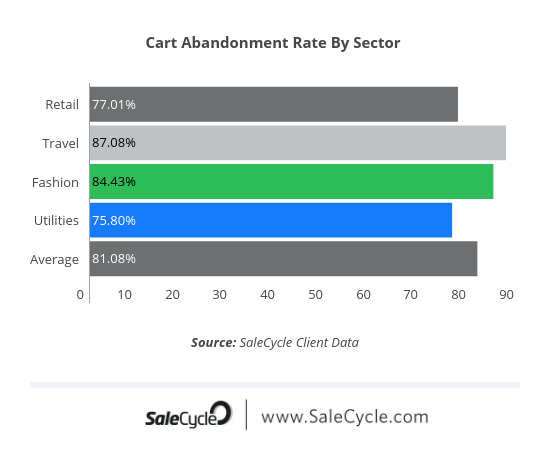
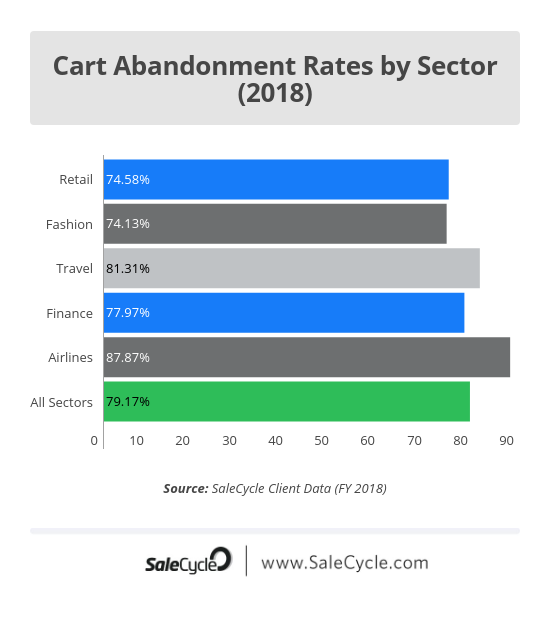
Cart Abandonment Rates By Sector
If you’re in the ecommerce industry you’ll know that cart abandonment is a fact of life. These cart abandonment rates vary by sector due to a range of different factors including research time, booking journey, average order value (AOV) and more. It’s important for any sector to optimise their abandonment strategy and recover as many online sales as possible.
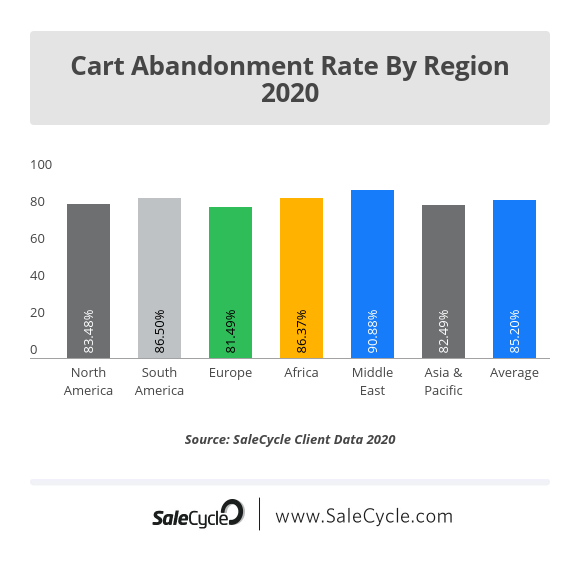
Cart Abandonment Trends By Region
Online shopping habits and user behaviour trends can affect regional cart abandonment statistics. Why? Because some regions are mobile-first, some regions have a less mature ecommerce market and because of this, younger markets do tend to have a higher abandonment rate than mature markets like Europe and North America.
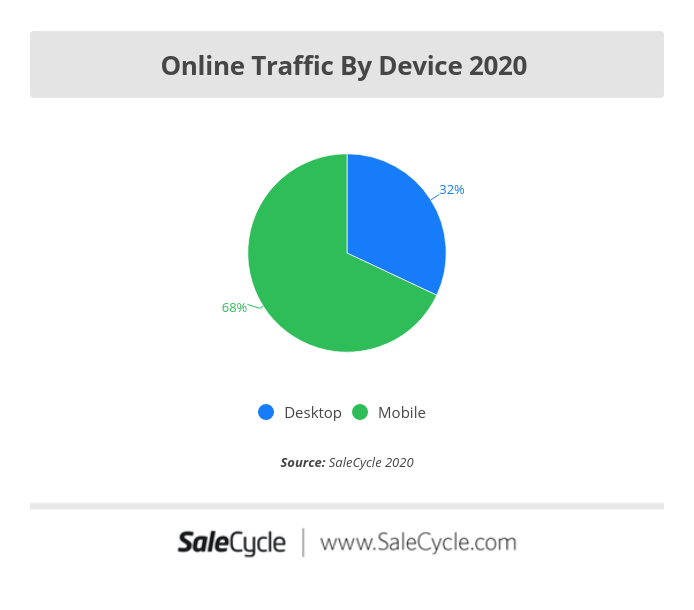
Online Traffic By Device
Traffic from mobile devices vastly outweighs desktop traffic in 2020, which is no surprise. Consumers are constantly plugged into their mobile devices with the latest shopping apps and internet services everywhere they go. One point to note is that conversion rates on mobile are still lagging behind the online user levels.
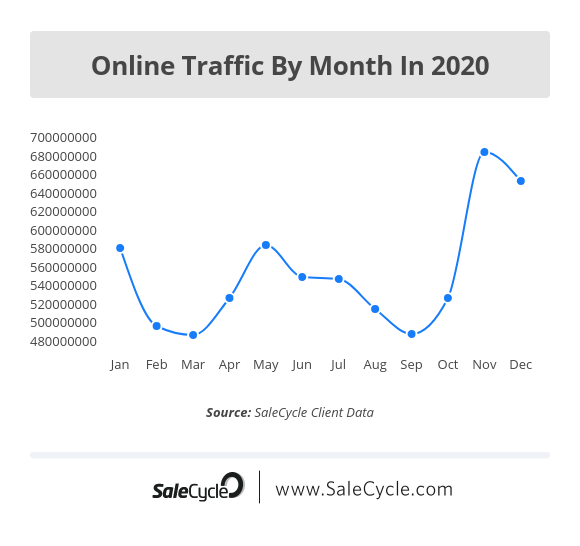
Online Traffic By Month
Learning buying patterns like retail, travel and fashion ecommerce retail trends gives you an edge over your competitors. Understanding your market cycles will help create a more effective marketing campaign while safeguarding your ROI.
We can see two major spikes in traffic here with the first one being in May, which comes after the global lockdowns from April due to the coronavirus pandemic. The second one we see is in November, which is typical of past patterns. November hosts 3 of the biggest sales holidays of the year with Black Friday, Cyber Monday and Singles Day. Businesses make drastic sales and offers for consumers with heightened marketing and scarcity tactics.
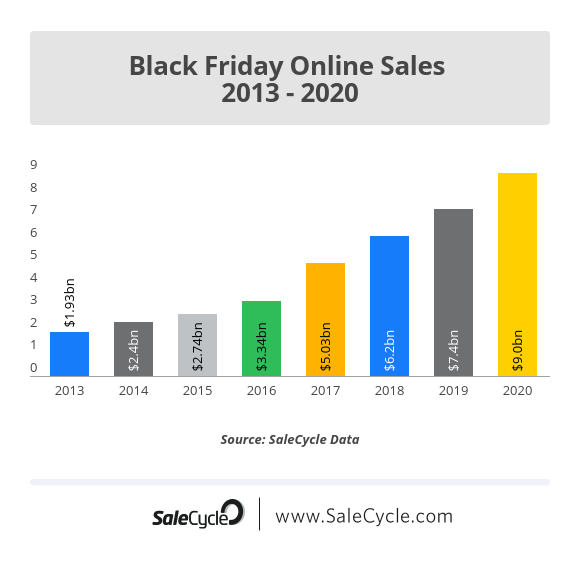
Black Friday Online Sales
Black Friday sales is one of the biggest shopping events of the year especially in Europe. In the last 5 years there has been experiential growth of over 3x in online sales value, reaching $9bn in 2020.
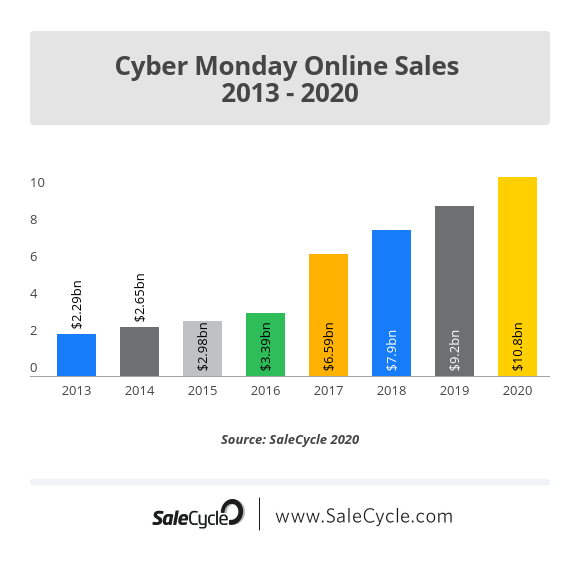
Cyber Monday Online Sales
Cyber Monday is the day after Black Friday and is an online sales event that happens after Thanksgiving. Similar to Black Friday, this holiday has grown enormously over the last 5 years earning $10.8bn in 2020, more than Black Friday. This is set to continue to grow as more businesses transition online and the amount of internet users increases.
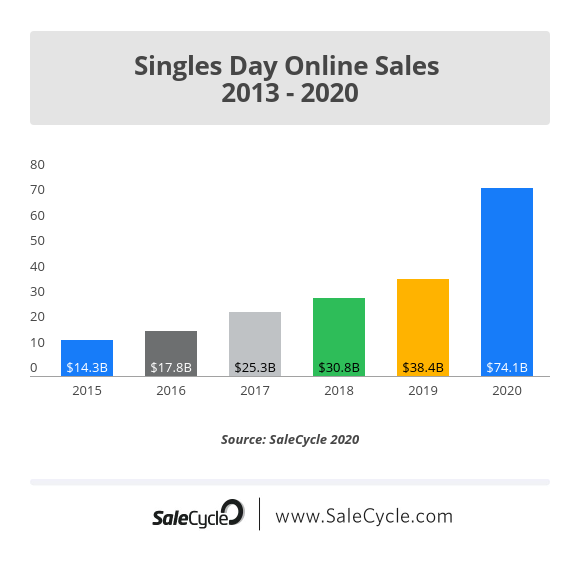
Singles Day
Of all three holidays, Singles Day is the Asian anti-Valentines Day shopping event. In 2020 it has generated $74.1bn in online sales. This highlights how mature the APAC market really is.
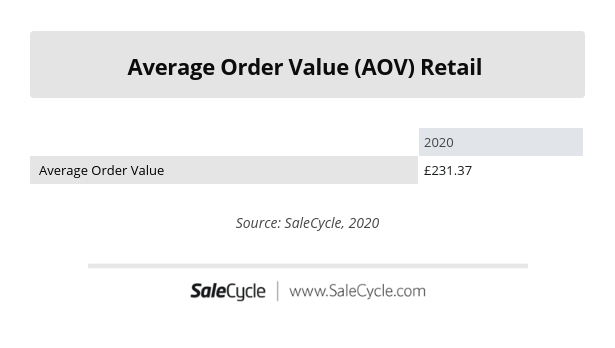
Retail Sector Average Order Value (AOV)
The average order value of retail products can vary, but the figure below includes all retail sectors. Of course there will be peaks in different categories at different times of the year. To drill down into these categories download the 2021 Ecommerce Stats & Trends Report.
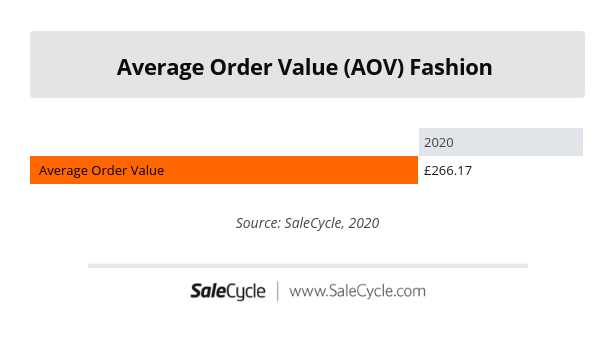
Fashion Sector Average Order Value (AOV)
The average order value of fashion products is slightly higher than retail. We can assume that consumer fashion is at the lower end with luxury fashion pushing up the average order.
Travel Sector Average Order Value (AOV)
Travel average order values typically spike at the start and the end of the year. We also notice AOV significantly higher on desktop than on mobile. We can put this down to the lengthy and complex booking process being more user-friendly on desktop. But this does present an opportunity for the travel sector to improve.

Best Ecommerce Stats 2018/2019
We look at some of the most interesting and useful ecommerce stats we’ve seen so far in 2019.
Ecommerce Market Size and Growth Stats (US)
In the US, ecommerce grew by 14.2% in 2018, reaching $517.36 billion.

Online retail had a 14.3% share of total retail sales in 2018, up from 12.9% in 2017 and 11.6% in 2016.
In this respect, the US is the third most advanced ecommerce market worldwide, with the UK and Germany in first and second place.
Ecommerce Market Size and Growth (UK)
In the UK, ecommerce has grown steadily, reaching £137.38bn last year, according to ONS data.

Online share of overall retail sales is currently 16%, up from around 9% in 2012.

Checkout Frustrations for Online Shoppers
A survey by Namagoo looked into the most frustrating parts of the checkout for desktop, mobile and tablet shoppers.

The same survey also asked customers why they abandon purchases during the checkout process. Shipping and fees are the biggest bugbear, followed by site errors and the need to register before checkout.

Mobile Commerce
A recent report from Qubit talks about the ‘halo effect’ of mobile, meaning that mobile activity influences customer purchases made on desktop.
According to the study, mobile activity directly influences an average of 19% of desktop sales. This influence is much higher for some categories, with Fashion seeing an average of 24%.
The study also looked at the reasons for lower mobile conversion rates, using data from a survey of more than 4,000 consumers.

Most Commonly Abandoned Purchases
A survey from Barclaycard found that the average British online shopper abandons baskets worth £29.37 every month.
The most commonly abandoned items were:
- Women’s knitwear
- Leather goods, such as wallets
- Women’s lingerie & hosiery
- Headphones
- Watches
- Women’s sportswear
- Women’s skirts
- Books
- Men’s trousers / jeans
- Women’s tops & shirts
Ecommerce Returns
According to Barclaycard ecommerce stats, UK online shoppers are ‘serial returners’ who send back goods worth £7bn a year.
It’s a tricky issue for retailers, as Rebound finds, with negative returns experiences meaning that customers may choose never to shop with a brand again. The importance of customer service can be showed through a great returns policy, when done correctly, this can have a positive impact on customer loyalty and retention.
It seems, the younger the customer, the less tolerant they are when it comes to poor returns processes, with 18 to 25 year olds more likely to get the hump.

Customers’ preferences for the method of returns is varied. The lesson for retailers here is that shoppers want choice.

Top Online Retailers
The top 30 online retailers from the UK, US and Europe, ranked by revenue, projected growth, physical presence, and online capabilities such as address verification, delivery and payment options. We also understand retailers like Boohoo and ASOS are able to offer promo codes offers.

Sales Volumes and AOV by Month
SaleCycle data shows how Black Friday and the Christmas shopping season impact on online sales volumes, with the number of transactions almost 80% higher than average in November and December.

When we look at Average Order Values by month, we see a different pattern. The holiday season means an increased number of online purchases, but the AOV drops, particularly in December.

Cart Abandonment Rates by Sector
The average cart abandonment rate for 2018 was 79.17%.
Use of Retailers’ Mobile Apps
Internet Retailer and Bizrate surveyed US shoppers on the retail apps they have installed on their phones.

Unsurprisingly, Amazon turns out to be the most commonly installed app.

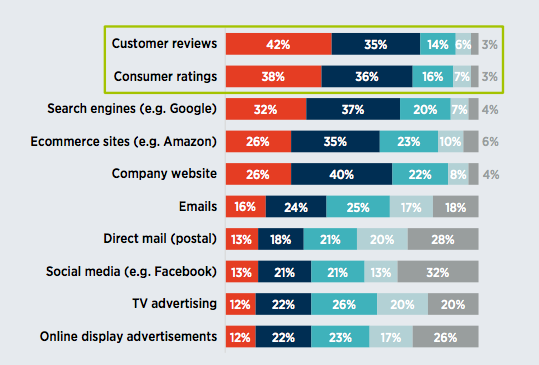
Consumer Reviews
A survey report by London Research looks at the importance of reviews and ratings in shoppers’ decision making.
Q: How important are the following sources of information when you are interested in buying something?
NEW EBOOK
⬛️ 2023 Black Friday Ecommerce Strategy & Stats Report
This FREE ebook gives you the methods, solutions & trends for building a high-converting remarketing strategy for Black Friday

Speak to an expert
Learn how to convert your online audience into revenue with our experts.

Brad Ward
Brad Ward is the SEO & Content Manager at SaleCycle. Brad is a former magazine journalist with over 8 years experience in digital, including SEO, social media and copywriting. Brad has written thousands of articles for a range of different sectors including online gambling, travel, education, sports and ecommerce.

![What Is A Good Conversion Rate? [Stats By Industry]](https://www.salecycle.com/wp-content/uploads/2017/10/Why-a-Structured-Approach-to-Conversion-Rate-Optimization-Is-Crucial.jpg)