SHARE


Black Friday 2023 has arrived and SaleCycle is bringing you live updates throughout the day with a focus on data, stats and trends. SaleCycle tracks millions of transactions every day and strives to bring you the best data to advise your Black Friday eCommerce strategies.
You can visit and refresh this page on Black Friday, the 24th of November 2023, to see the updates as they happen throughout the business day.
We’ll be looking back at previous data from past events, but if you’d like to take a look at the data from 2022, 2021 and 2020 as it happened you can scroll to the bottom of the page.
If you’re looking for a full breakdown of how e-commerce companies should prepare for the heavy sale periods, you can download our Black Friday 2023 eBook completely free.
Key Black Friday 2023 Stats

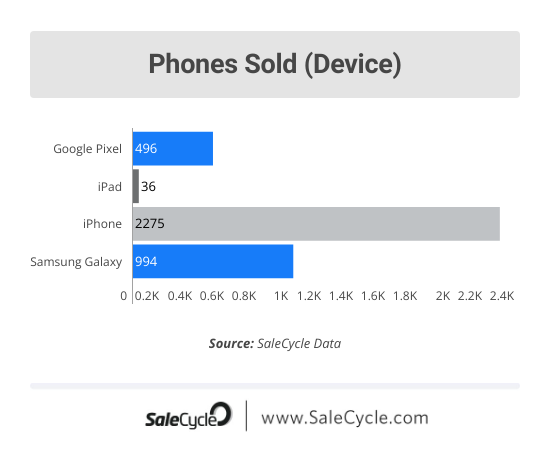
Mobile phones are one of the most sought after items every Black Friday. Which device will come out on top?
So far today we’ve seen a clear winner with our sub-sector of data showing 2,275 iPhones being sold vs. 994 Samsung Galaxys and 496 Google Pixels.
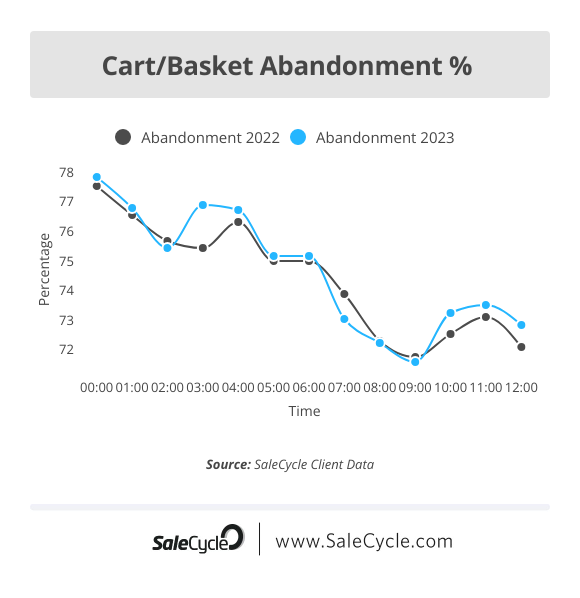
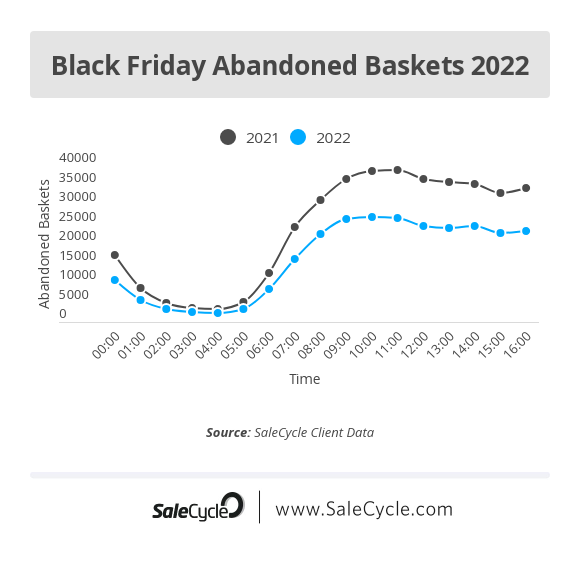
Cart/basket abandonment rates are a great way to measure a sites ability to convert. A higher abandonment rate could mean better prices elsvwere, an issue on site or even a complex checkout process. Lowering this number by even 1% could lead to huge gains in revenue. So, what are we seeing so far this year vs. 2022?
7am looked to be when 2023 started to show higher conversions, this had subsided an hour later, with 10am-12pm showing 2022 as the year where conversion was king. Although this could be an issue for ecommerce brands, many will be hoping their cart abandonment emails will pull these conversions back in line and give additional uplift to Black Friday revenues.
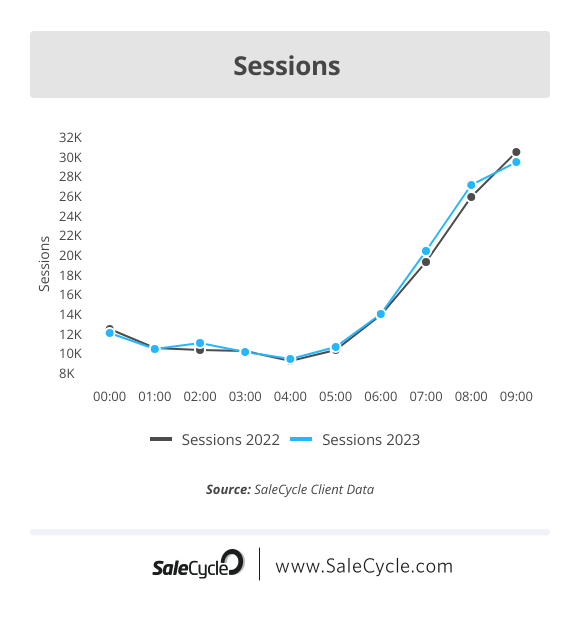
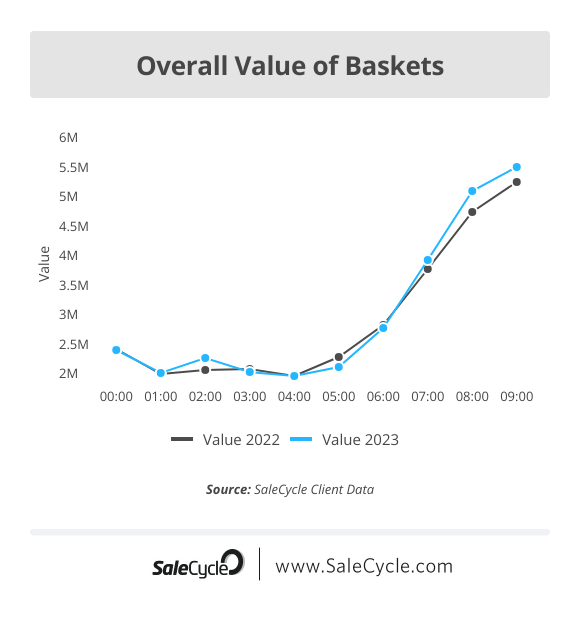
Although it looked like potentially being slower Black Friday than usual, sessions and value of sales are showing the potential to be higher than 2022.
Our sub-section of data is showing £248,518 more spent between 9-10 am vs the same period timeframe last year, though 1,018 less sessions.
This points to users spending more through less sessions as the first marketing messages of the day begin to get opened/viewed.
Friday 24th November 2023
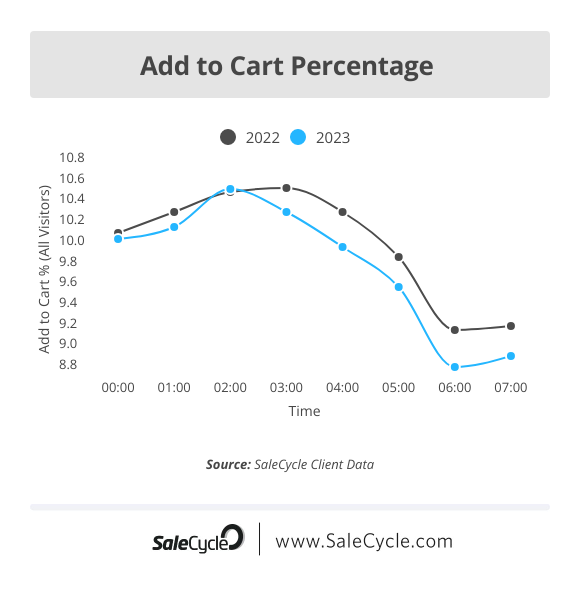
Early signs from the add to basket rates from 2022 to 2023 suggest that site visitors are browsing more. This could be linked to higher price sensitivity and product comparisons across websites.
At 6.00am in 2022 9.22% of all site visitors would add an item to basket, at the same time at 2023 this has dropped to 8.96%
All of the data in todays live blog will be collated using SaleCycle client data across a sub-section of retail, travel and fashion industries.
Tuesday 21st November 2023
Although it’s common to see Black Friday offers appear early, we’ve noticed a visible trend across email, SEO, PPC and display marketing channels pushing deals from companies that would usually hold until the day itself.
What could this mean? Generally, this could lead to lower traffic and overall conversions on the 24th of November, but potentially a more prosperous November.
Brands that have collected compelling customer data over the past few years have leaned on this to offer ‘early access’, ‘VIP discount codes’ and other attention-grabbing concepts with a view to elongate the Black Friday experience. This will likely culminate in additional lines/products being added on the day itself.
Black Friday 2022 has arrived and we’re excited to be able to bring you live updates throughout the day.
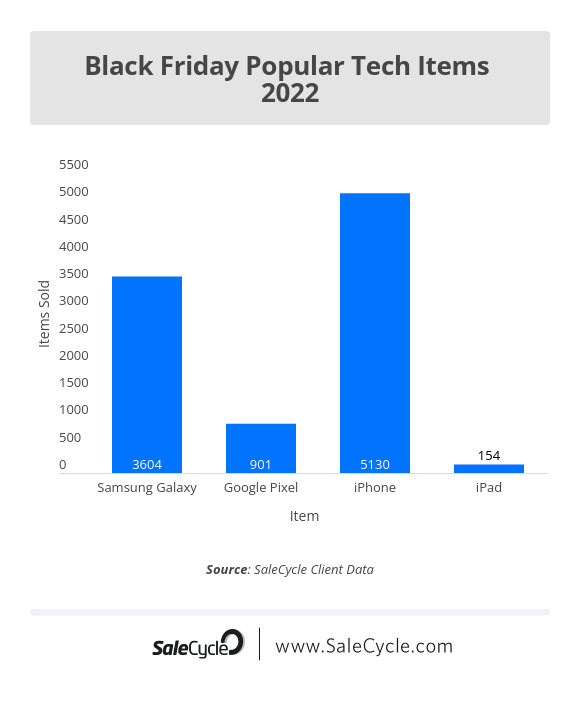
Black Friday holds the opportunity for consumers to grab hold of discounts in sectors with typically high AOVs – such as the Technology sector.
During Black Friday 2022, our client data concluded that the iPhone was the most popular mobile phone according to online sales, followed by the Samsung Galaxy. Although Apple sees a vast and growing number of sales year upon year, Android technology is slowly but surely becoming a more popular choice among tech consumers.
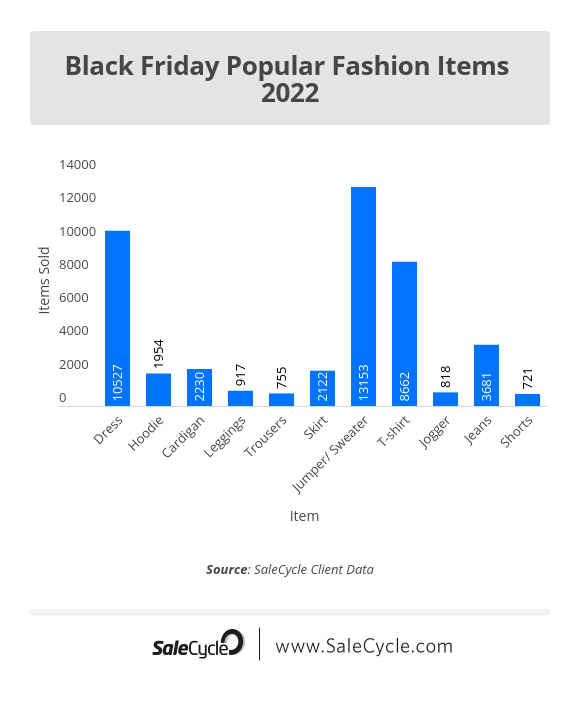
The Fashion sector tends to stand out amongst all others in ecommerce when it comes to sales periods – especially Black Friday – in both online activity and volume of sales. When we look into this sector further, we can see which individual items stood out the most after this day of Black Friday sales.
Jumpers and sweaters boasts the highest amount of fashion items sold, followed by Dresses. This should come as no surprise, as this season holds the need for warm winter-wear as well as festive celebrations (Christmas and other Holiday parties etc.) where dresses could be the most appropriate choice of clothing.
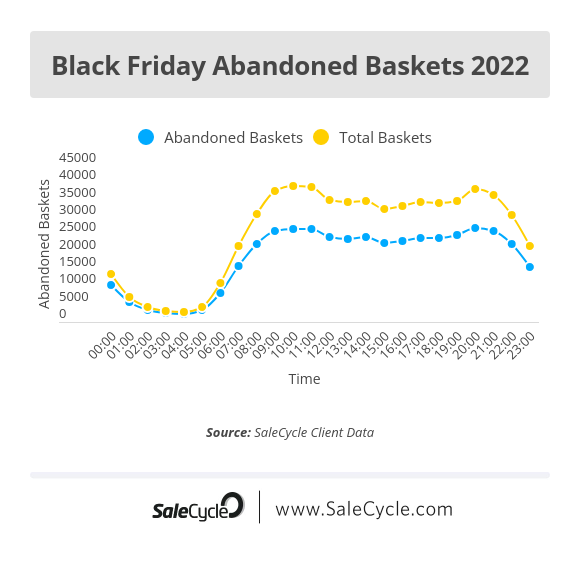
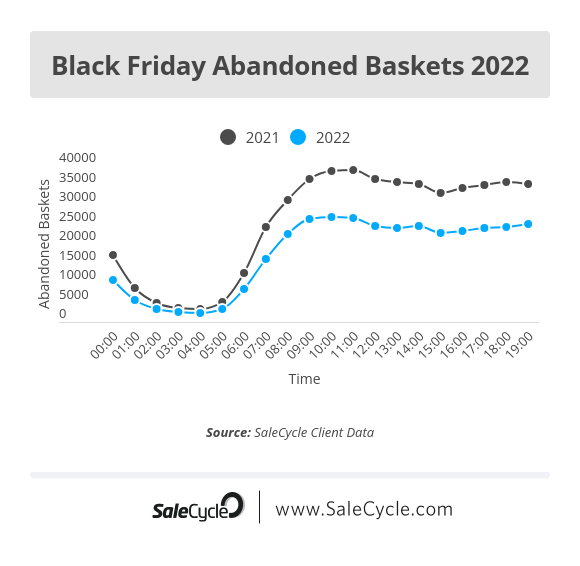
When we compare abandoned baskets to total baskets throughout the day, we can see similar trends in regards to peaks, troughs and consistencies, and begin to paint a picture of the customer journey during a major sales period.
We can see that customers are more engaged during two key periods of the day – morning (09:00am – 11:00am) and an evening period (20:00pm – 21:00pm). Anticipation at the beginning of the sales day is matched with an urgency to secure deals towards the end – two key times to target your audience.
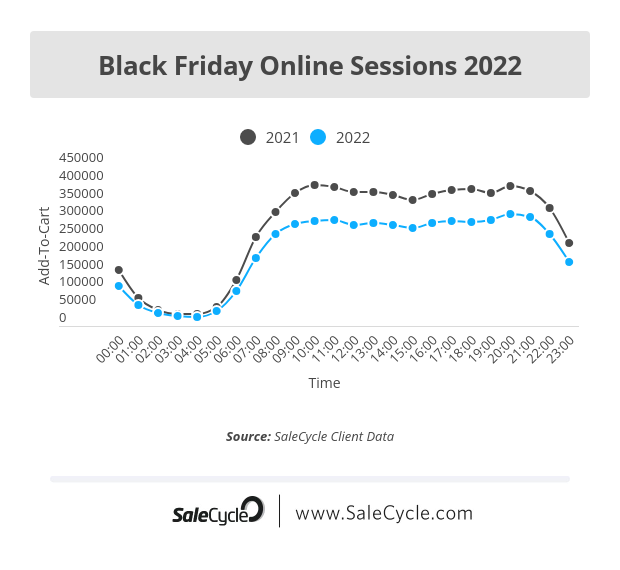
Black Friday online sessions saw an incredibly steady volume throughout the entire day after 09:00am, however we’re now seeing a sharp decline after 21:00pm.
Although 2021 saw a much greater number of online sessions as a whole, a similar pattern of consumer behaviour is being revealed here. Ecommerce marketers can utilise this kind of information around engagement volumes in future sales events in order to capture the best and most attentive audiences – whether that’s to target while urgency is high or on the other hand, when sessions and sales can be improved.
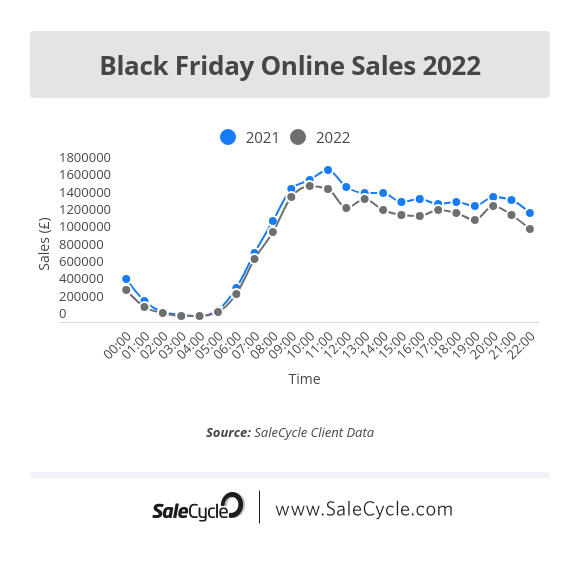
After quite a consistent number of online sales between the hours of 14:00pm and 21:00pm (apart from a slight peak at 20:00pm, much like last year), sales are now beginning to decline as we head towards 22:00pm.
This could suggest that the urge to buy is beginning to lessen, and consumers that have already taken advantage of sales throughout the day (particularly around the 10:00am – 11:00am point), have began to decrease after a rather steady sales period between 14:00pm and 18:00pm.
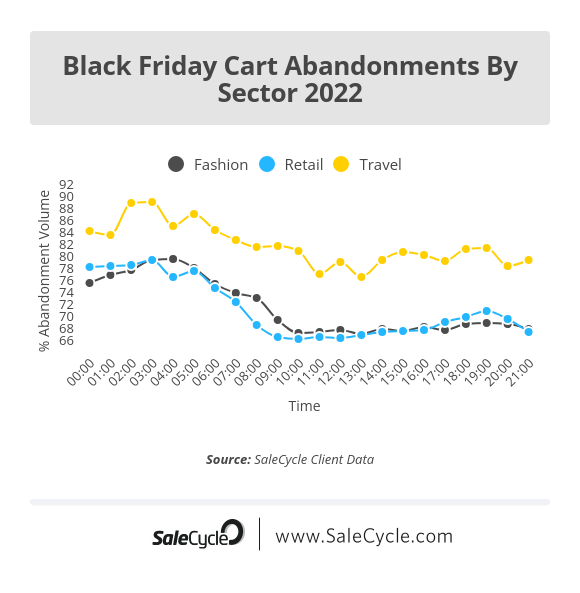
The Travel sector continues to hold the highest rate for cart abandonments throughout the evening. Retail has seen the lowest abandonments out of the three categories tracked throughout Black Friday, with the lowest rates at around 10:00am.
With many products falling under the Retail sector, we can expect that more urgency to buy comes with this array of products on offer – such as electronics, groceries and other typical consumer goods.
Individual basket abandonments follow the same trend as total baskets created at this point in the early evening. When we take downtime into consideration as a situational shopping factor, we can assume that customers feel more freedom to create baskets and browse (and therefore abandon) out of working hours.
However volumes are still relatively high, showing persistent customer intent.
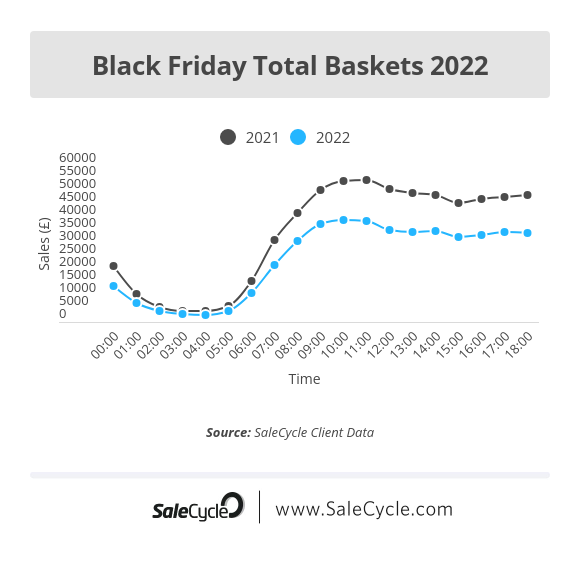
The total amount of baskets have been accumulating at a steady rate from around the 12:00pm mark, seeing an average of 34,248 baskets until 18:00pm. This is slightly lower than this year’s most recent peak at 10:00am – where the most baskets created by our clients stood at 39,176.
Although we’re not seeing as many sessions as last year, we’re roughly on par year-on-year in terms of online sales value, despite factors such as the 2022 economic crisis.
So with lesser volumes of customers and fewer baskets being created – we can assume that consumers are spending more per session. According to SaleCycle data so far, the average value of a purchase last year was £108.10 and this year it has risen to £125.43.
The number of abandoned baskets has seen relatively steady volumes between the hours of 12:00pm – 16:00pm as we carry on through today’s Black Friday event.
Abandoned baskets saw a peak at 10:00am – 11:00am much like last year, showing a greater intent to buy later on in the day.
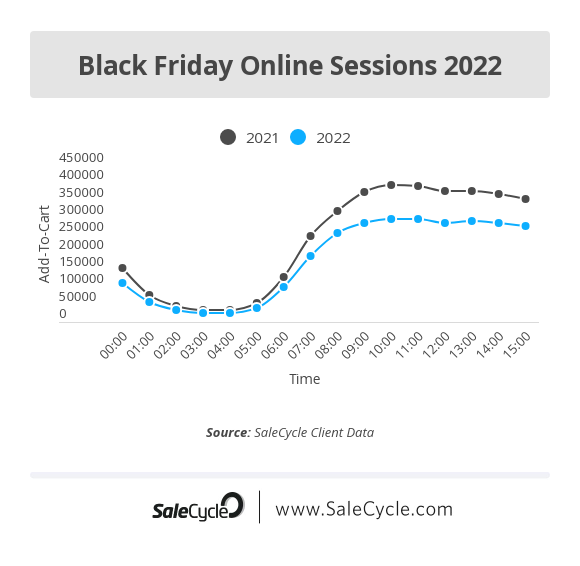
We can see here (above) that online shopping sessions are lesser in volume this year compared to last year, but hold the same peaks and troughs as we approach the late afternoon.
However, according to SaleCycle data, although individual customer sessions are down, customer browsing time has increased this year, with consumers browsing through an average of 6.98 pages per visit compared to 5.91 on the previous Black Friday.
This may indicate customers are becoming more price conscious before committing to a spend, but also emphasises the need to have a good user experience and suitable interventions, so that they are not lost during their extended journeys.
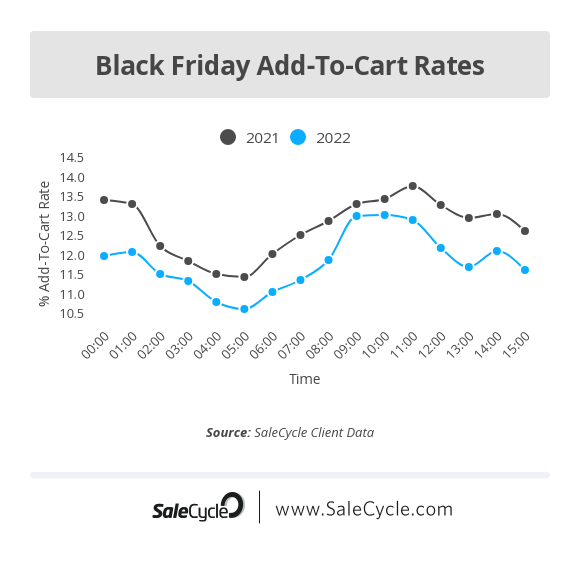
Add-To-Cart rates saw a spike and second peak after 14:00pm as we head into the early evening, after both 2021 and 2022 saw the most items added to carts between 10:00am – 11:00am.
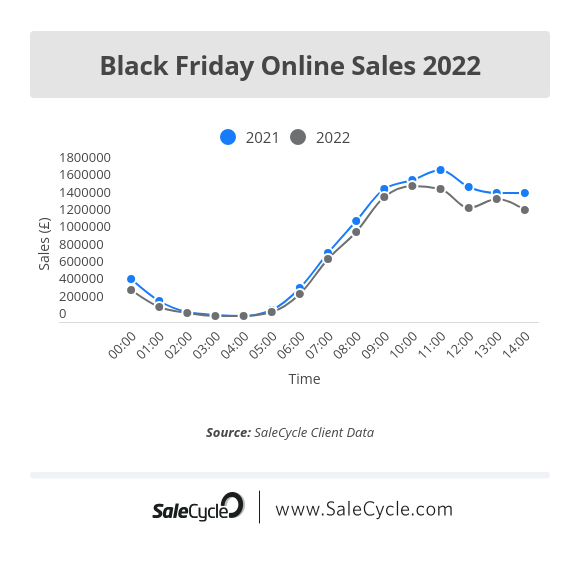
Although we’re not seeing as many online sessions as last year, we’re roughly on par year-on-year in terms of Total Sales Values. So although we’re seeing less sessions, revenue is about the same – but with fewer baskets.
This could suggest that people are spending more per basket. According to the data we have collected so far, the average order value of a purchase last year was £108.10 and this year it’s up to £125.43.
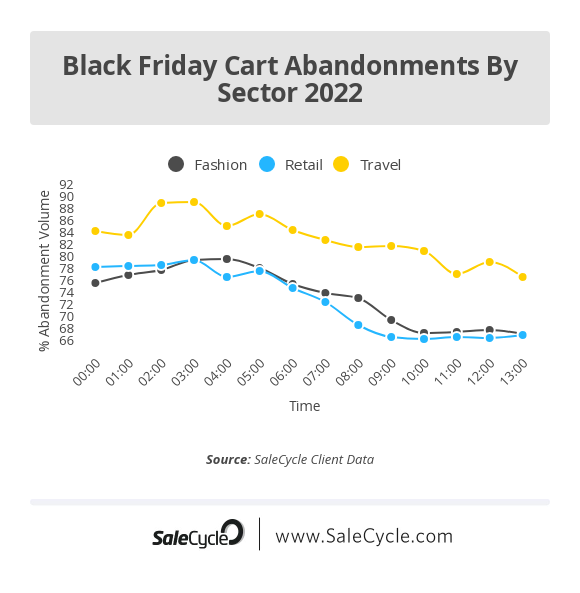
When we dissect cart abandonment rates by sector, we can see that shoppers are most likely to abandon when making a Travel booking. This is likely due to the higher AOV of the Travel industry, encouraging browse sessions across multiple platforms and therefore a lower sales commitment.
The Fashion and Retail sectors hold similar cart abandonment percentages, highlighting that the lower AOV of these sectors encourage a greater urge to buy.
All sectors, however, are currently experiencing lower abandonment rates as we head into the afternoon. We can predict that shoppers are committing to more baskets before an expected surge of online activity this evening.
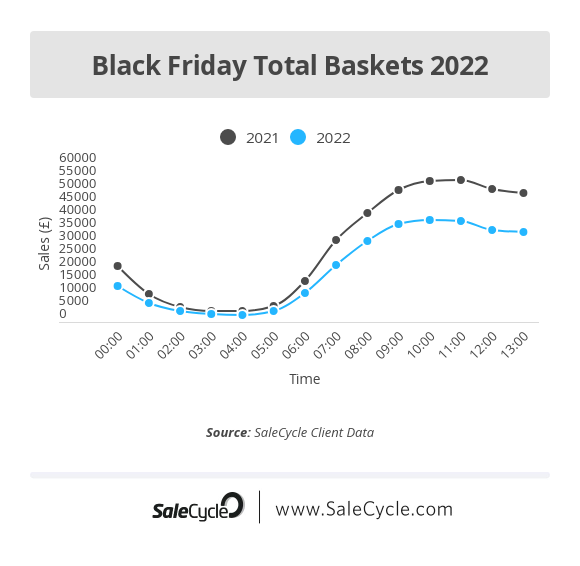
We can see that there is a significant difference across the board in this years Black Friday UK numbers. We can see this decrease in numbers here in total baskets created. At 13:00pm, total baskets are 30.43% lower than in 2021.
Although we see a similar hourly trend, factors such as the current economic crisis and other economical aspects may be the cause of a lower volume Black Friday in 2022.
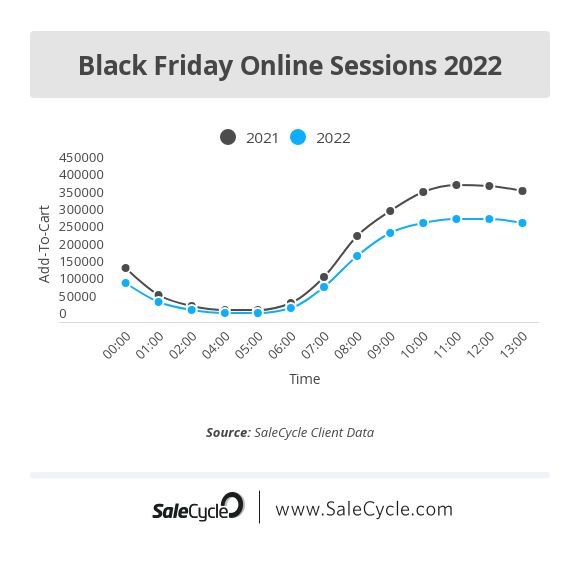
Much like last year (2021), online sessions in the UK have seen a steady increase to a peak between 10:00am and 11:00am. We’re now experiencing a deficit in online sessions heading into the early afternoon, when shoppers are more likely to continue their working day after a typical ”lunchtime” period. High browsing volumes, despite the drop, continue.
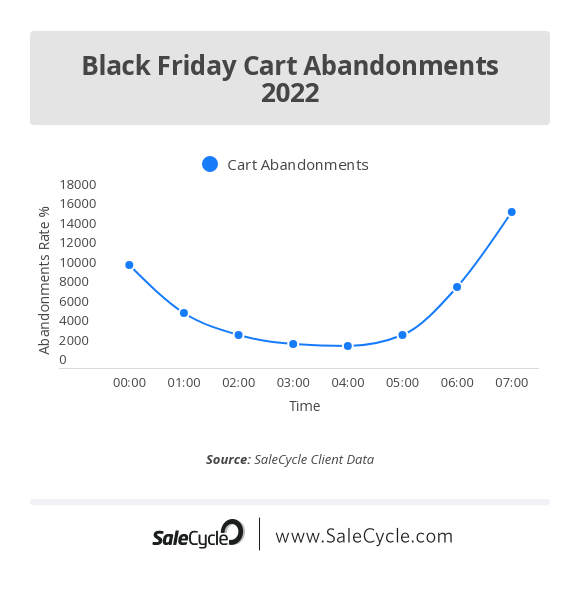
Cart abandonment rates follow suit, and are steadily increasing as the day goes on. Generally, more online sessions equal to more abandonments made – so this trend is to be expected. Black Friday sees the opportunity for sales across multiple brands, causing carts to be abandoned to browse other sites before ultimately committing to a purchase.
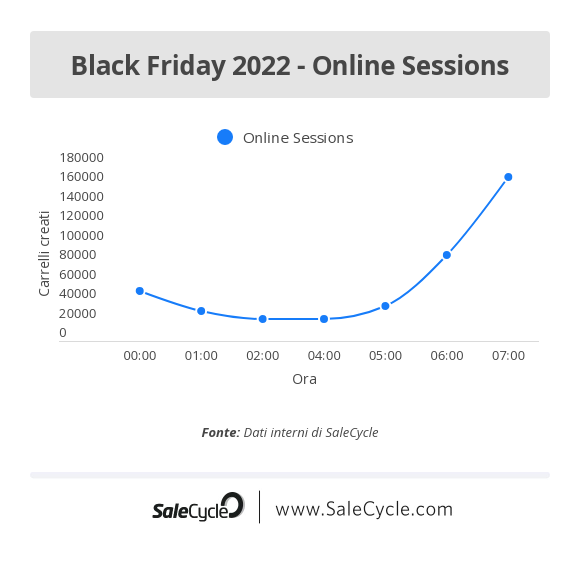
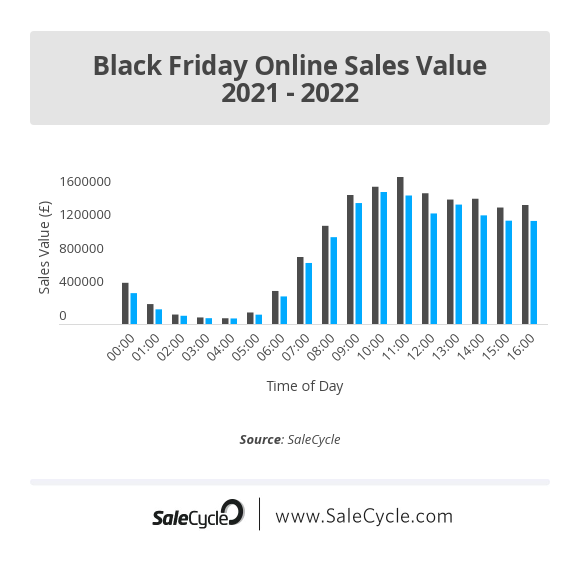
Black Friday 2022 online sessions/ traffic mirrors online sales during the early hours of this morning – meaning that more people are using their shopping sessions to commit to a sale rather than just to browse.
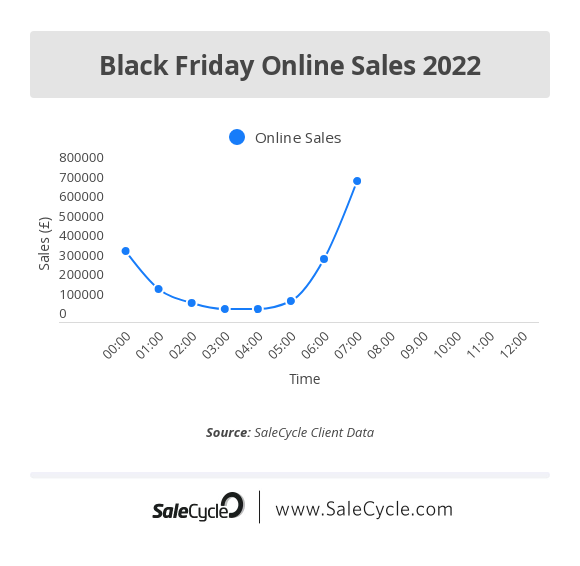
Black Friday 2022 has kicked off, and we can already see online sales rising heavily after the 05:00am mark, after an expected lull in sales throughout the early hours of the morning. The Black Friday online sales value currently stands at £721,008.49, due to continue to rise throughout the day.
Black Friday 2020 has arrived and we’re excited to be able to bring you live updates throughout the day.
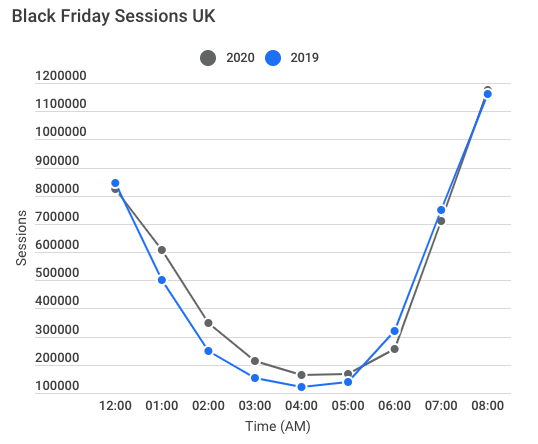
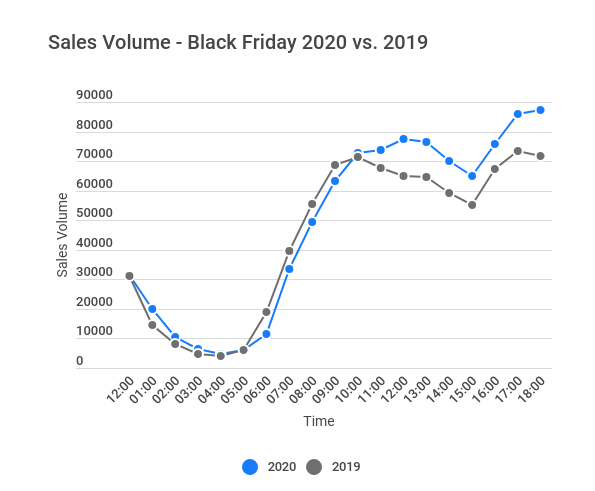
(9.00 am UK) To kick us off today we’ve seen more sales volume activity in 2020 vs. 2019 from 1am until 4am. However, since 6am sales have dropped slightly versus 2019.
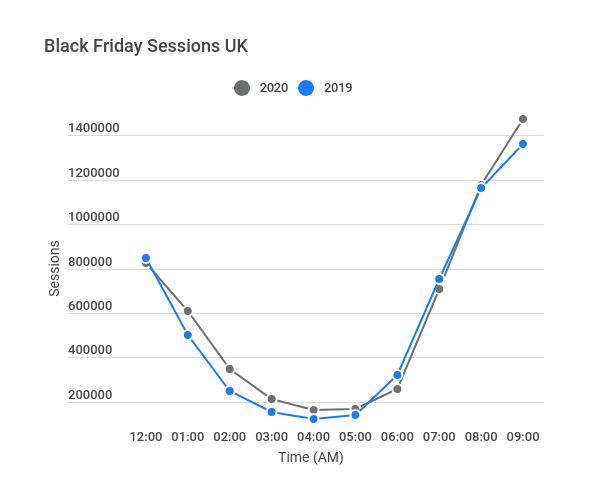
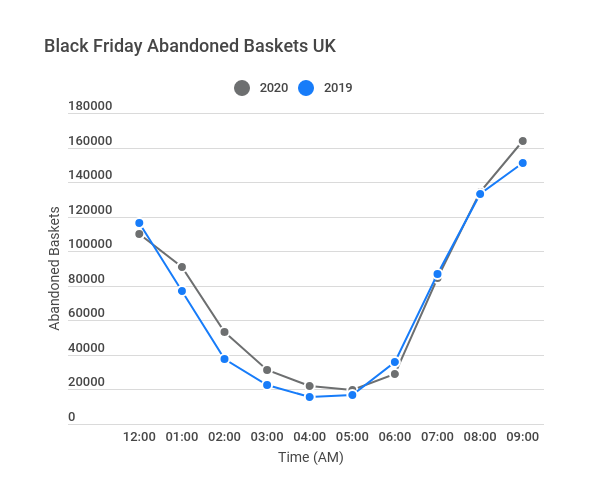
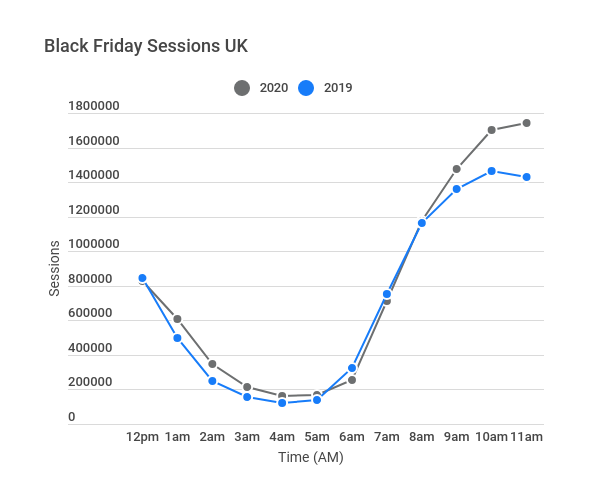
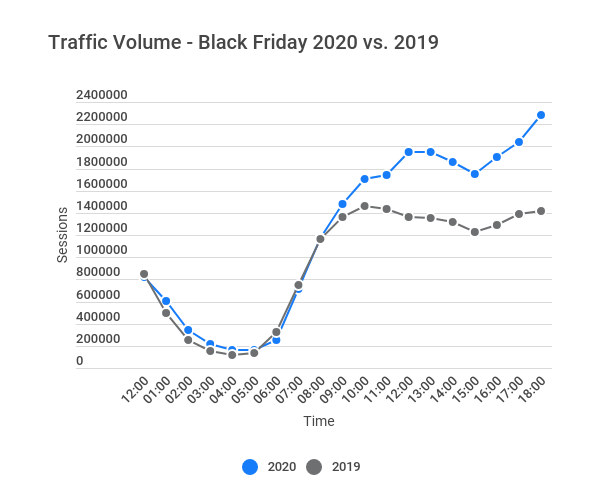
(11.00 am UK) After being initially overtaken at 6 am, traffic sessions for 2020 have now retaken a lead at 9 am versus 2020. This is broadly in line with UK Abandoned baskets.
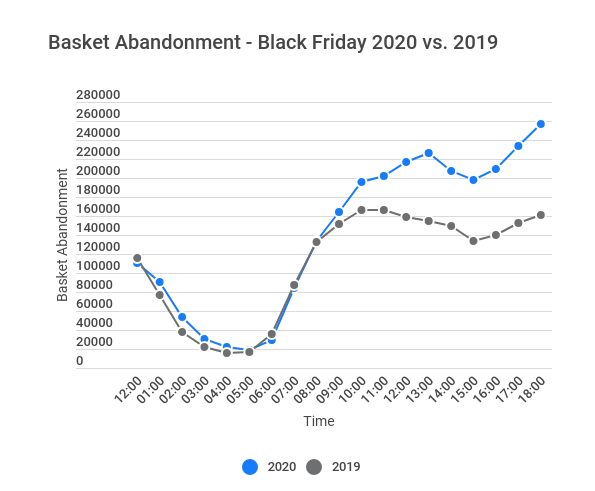
Will abandoned baskets increase throughout the day? So far they are up in comparison to 2019.
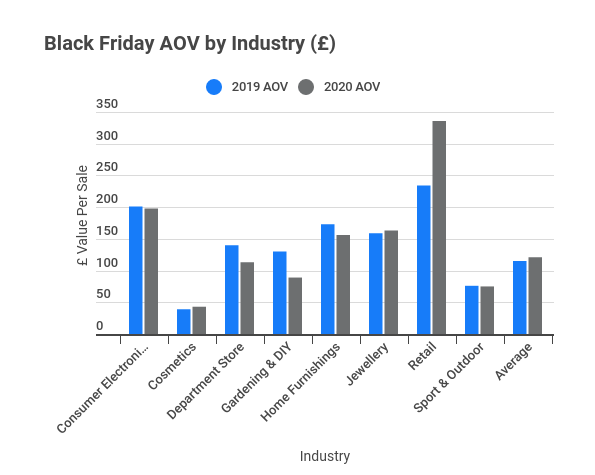
(11.45 am UK) Average Order Value (AOV) is an important metric. Getting additional revenue through up-sell can make or break a sale campaign. During Black Friday Sales this metric can sometimes be skewed due to large discounts. So far this year the average basket value is £121, £6 more than the average basket in 2019. It would appear people are cautiously starting to buy more.
(1pm UK) Sessions stats in the UK are now pulling ahead of 2019. This is starting to correlate with sales figures.
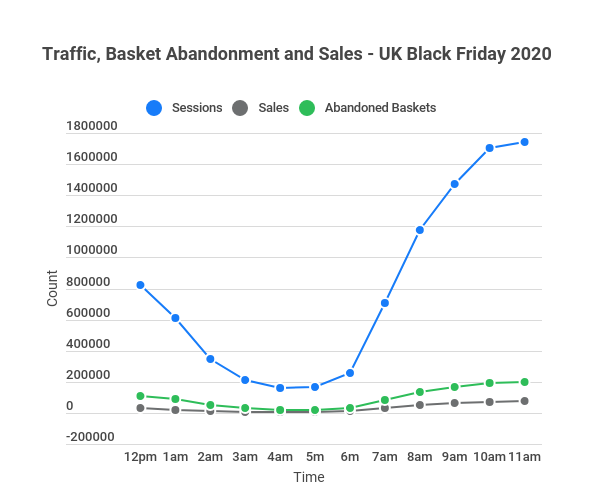
(1.25 pm UK) Looking at the current data for sessions, shopping cart abandonment and sales for Black Friday 2020 in the UK so far, we can see a high volume of traffic and a slight lift in sales and abandoned baskets. This could be linked to people researching items in the build-up to lunchtime (historically a period of high online sales volume). The lift in abandoned baskets is a direct result of the higher traffic. More traffic, more abandonments.
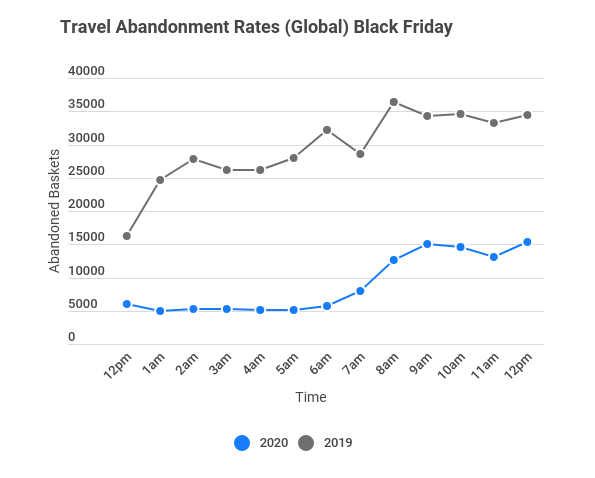
(2 pm UK) The travel industry has been harder than many throughout the COVID19 pandemic. The government in the UK have released a tiered plan as we emerge from lockdown. This recent update could have potentially aligned with travel agents, hotels and airlines trying to build back their industry. We’re seeing early signs from basket abandonments today that suggest people are still looking and putting holidays, bookings and trips in their baskets. Is this the first sign of a recovery for the travel industry?
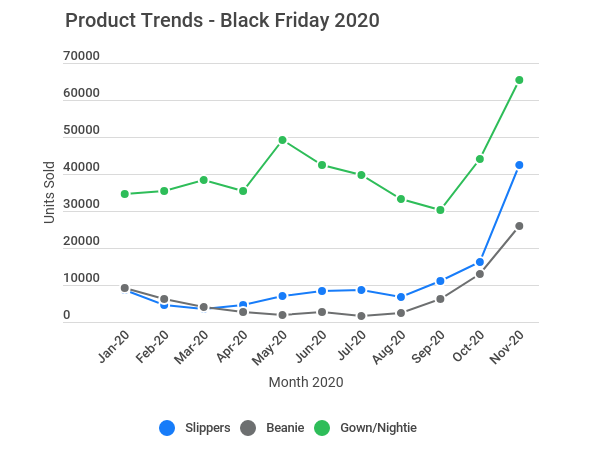
(2.30 pm UK) It wouldn’t be Black Friday at SaleCycle without some product stats. We’ve seen a lift in sales of some key items that will get anyone ready for the winter holidays. Despite a spike of gown sales in May 2020, the Black Friday sales have delivered a yearly high.
Slippers have seen steady sales volumes all year, but the cold weather has seen uplift culminating in a Black Friday spike.
I’d suggest these trends are a combination of people preparing for more work from home scenarios and early Christmas present purchases.
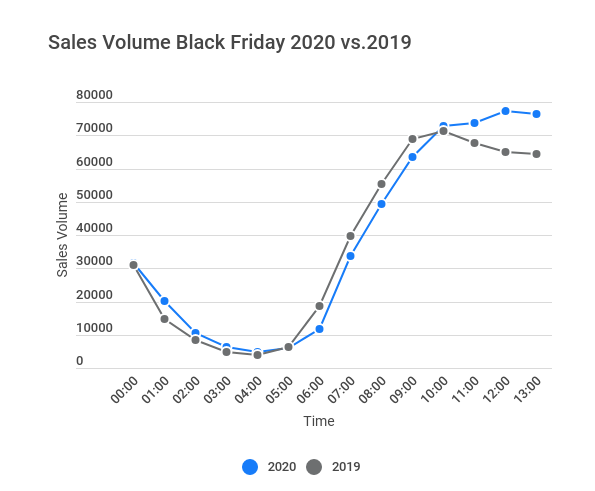
(3.30 pm UK) As expected, Black Friday 2020 sale volumes in the UK have started to trend above 2019. This is a shift in buyer behaviour form 2019, where an early morning sales rush can be seen, curving off before lunchtime. This year the sales volumes have continued to grow after the morning rush. This is likely due to the increased number of shoppers working from home and having additional time to make purchases around their work.
(4 pm UK) Sales volume is up, as you can see from the previous graphs for Black Friday 2020. What impact is this having on the overall value of all transactions?
This metric can be heavily influenced by a number of factors including level of discount, items per transaction and ultimately product type purchased.
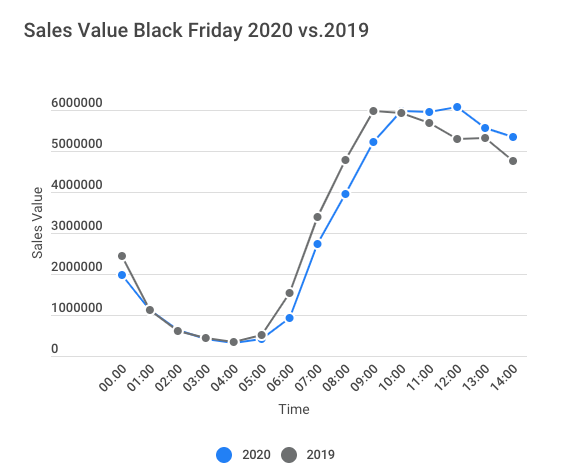
It’s clear that the increase in sales volume for Black Friday 2020 didn’t correlate with value after 12 pm. This suggests lower sales revenues being taken despite higher sale volumes. The lunchtime sale rush appears to have yielded lower priced items. Stocking filler shopping perhaps?
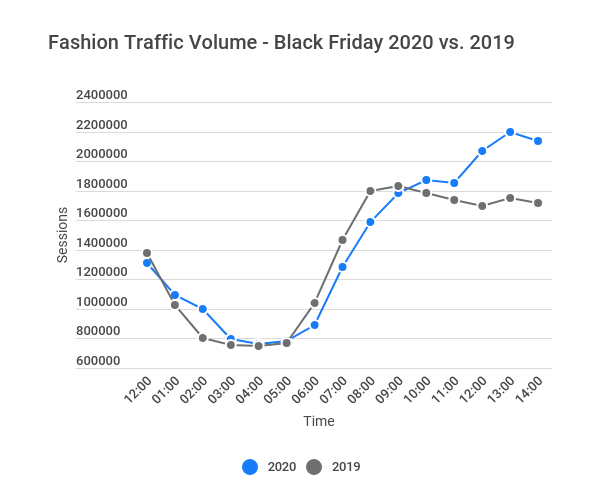
(4.30 pm UK) We’ve covered the state of the travel industry, which accounts for a large proportion of our household disposable income spend per year. So what is powering the increased sales and traffic numbers in 2020?
It’s looking like fashion is one of the main driving forces behind this additional traffic.
(7 pm UK) As we move into the evening of Black Friday in the UK it’s clear that the necessary movement of businesses to be more focused on e-commerce has yielded online growth in 2020.
The true impact on the future of the high street won’t be known for some time to come, but fashion ecommerce retail trends is a shining example of how retailers have adapted. It’s been great to see new styles of data capture and cross-sell and upsell across all industries. We’ll be sure to compile some of our favourite examples in our upcoming Look Book series coming soon.
(8 pm UK) Before signing off for the evening, we wanted to share some encouraging insights from the end of the day in the UK. Traffic uplift looked to be decreasing by 3 pm, but a sharp upturn was noticed at the 4 pm mark and has increased ever since. This suggests that the Black Friday shoppers are planning on purchasing into the evening. It is clear to see the growth curve of 2020 versus 2019, hopefully these incredible figures continue into the night.
Alongside this incredible traffic growth, we’ve tracked a comparative lift in basket abandonments. Companies facing this issue should ensure they have an appropriate retargeting strategy in place. SaleCycle are experts at recovering abandoned sales and improving conversion rate optimisation. If you’d like to find out more, request a demo and we’ll do the rest.
One of the most important metrics from Black Friday 2020 is the sales volume. It’s great to see that the increase in traffic has led to a similar increase in sales. It’s important to track online traffic and sales patterns because the busiest retail months online, such as Black Friday presents a huge opportunity online sales and micro conversions. The growth from 4 pm in the UK has continued on an upward trend until a slight level-off at 6 pm. We’ll be exploring the full impact of this into next week and benchmark Black Friday 2020. We’ll also be taking some time to examine what this means for the Chrismas sale period.
Thanks for taking the time to read our live updates, have a great weekend.
NEW EBOOK
⬛️ 2023 Black Friday Ecommerce Strategy & Stats Report
This FREE ebook gives you the methods, solutions & trends for building a high-converting remarketing strategy for Black Friday

Speak to an expert
Learn how to convert your online audience into revenue with our experts.


![Valentine’s Day Ecommerce Tips and Trends [2024 Strategy]](https://www.salecycle.com/wp-content/uploads/2019/01/valentines-ecommerce-1.png)