
SHARE


With mobile taking up the majority of ecommerce browsing, sales and overall conversions, it’s important for etailers to focus on the behaviours of online visitors to avoid shopping cart abandonment.
During peak times for online shopping it’s essential to convert your users either for a sale or through micro conversions to use later down the line when taking mobile activity into consideration.
In this article, we take a look at a selection of mobile commerce stats from the brand new 2023 Ecommerce Stats and Trends Report, including market size and growth, conversion rates, and share of traffic and sales by device. We also provide some key mobile scenarios and examples, to help you boost your mobile conversion rate.
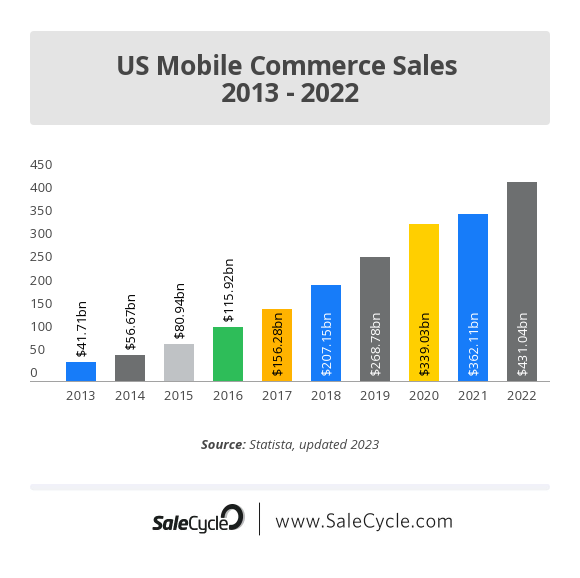
US Mobile Commerce Market Stats
Mobile commerce sales were worth a huge $431.04 billion in 2022, up from $362.11 billion in 2021 and creating a steady upwards trend into the present day. We can only assume that this steep incline continue into the future of global ecommerce, becoming the very fabric of marketing strategies for online brands
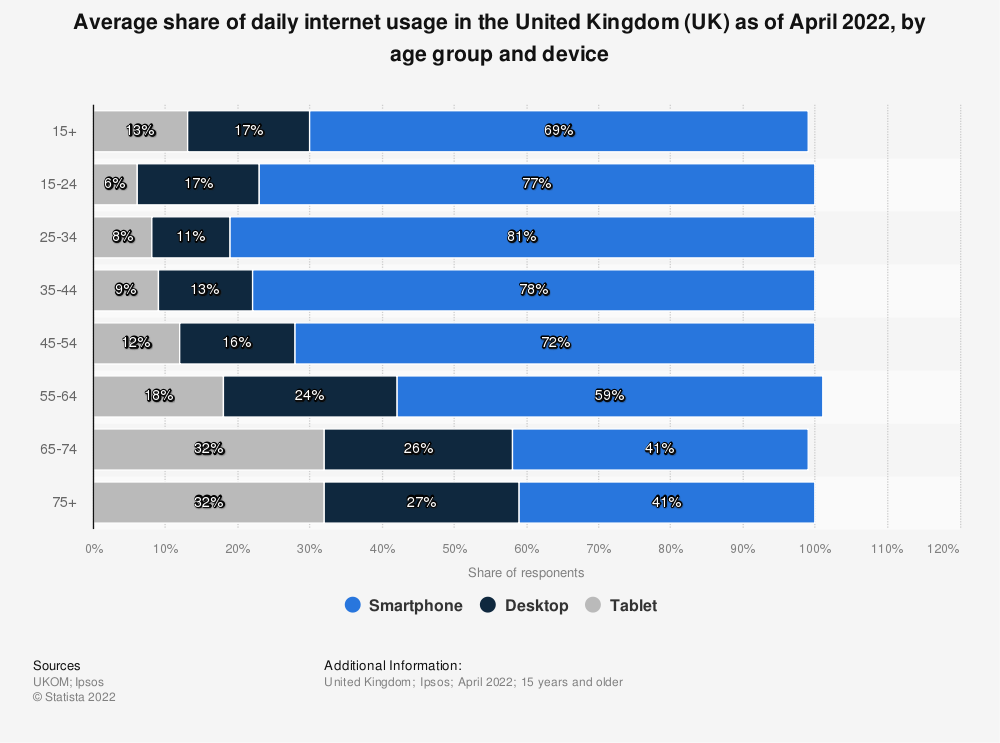
Mobile Internet Usage by Demographic
Mobile usage accounted for a greater average daily share in the UK, especially among the 20-34 age group and demographic with 81% – according to a 2022 study carried out by Statista. For this reason, retailers targeting younger demographics (the fashion sector, for example) have focused heavily on mobile usability.
These findings could help emarketers grasp a further understanding of their target audience to produce more defined versions of targeted ads, personalised emails such as browse abandonment emails and targeted pop-ups depending on the age group and device being used.
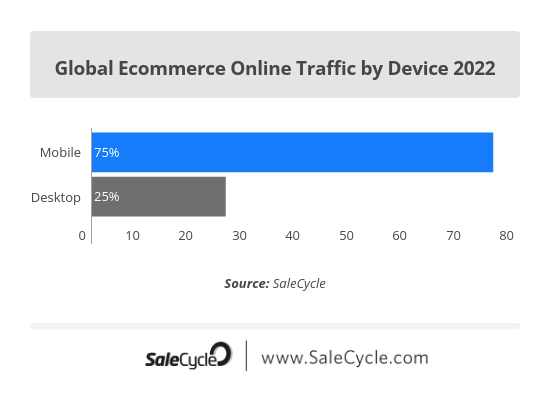
Online Traffic by Device
As we have already seen, mobile ecommerce continues to grow year on year. Mobile now accounts for 75% of online users – a 4% increase compared to last year.
We can see mcommerce becoming a standard part of most of our mobile visits. Even social media sites such as Facebook, Twitter, and Pinterest have all introduced ecommerce CTAs in the form of “buy buttons” that let shoppers make purchases without having to leave the platform. This is becoming even more noticeable as millennials and Gen Z consumers hold huge spending power.
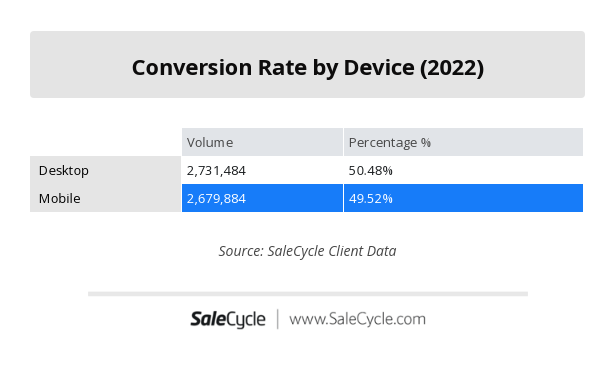
Mobile vs Desktop Conversion Rates
Mobile conversion rates are still behind desktop, even though various studies and our own client data shows that mobile devices are more heavily used. This highlights intent, and the ability to browse depending on the device you are using. With mobile, consumers have the ability to access their devices sporadically throughout the day, perhaps causing them to abandon – and not convert – more frequently compared to desktop, where buying intent is higher.
Throughout etail, it’s important to consider that users can change their device multiple times throughout the day. For example, online shopping, browsing social media and searching on Google can result in device switching. This means optimising both digital experiences is more nuanced than we might think.
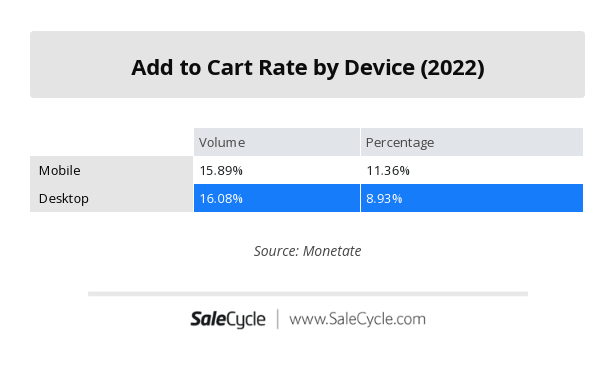
Mobile vs Desktop Add to Cart Rates
While mobile conversion rates are much lower than desktop, add to cart rates are much closer.
This suggests that people are entering the ecommerce checkout process on mobile, but are being deterred from completing purchases.
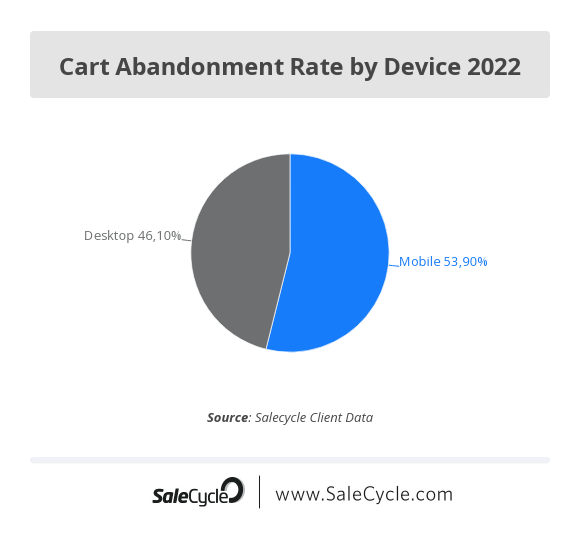
Cart Abandonment Rates by Device
Consumer behaviour changes due to many different factors including AOV, ecommerce payment methods, device, product and so on. It could even come down to the customer experience on certain devices that deter a customer from completing their purchase. It’s important for each sector to understand their customers so that their advertisements and customer journey are more effective – no matter the device.
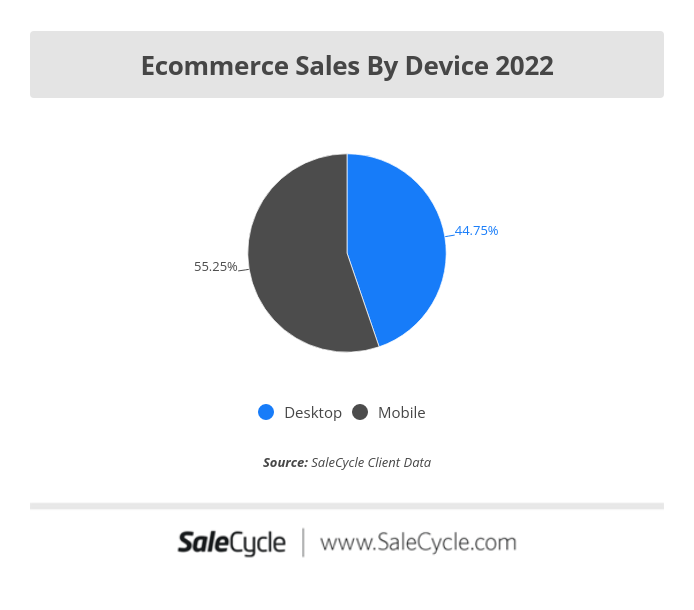
Online Sales by Device
The above findings are also reflected in the total amount of sales when we compare mobile and desktop sessions – with mobile making up over 55%.
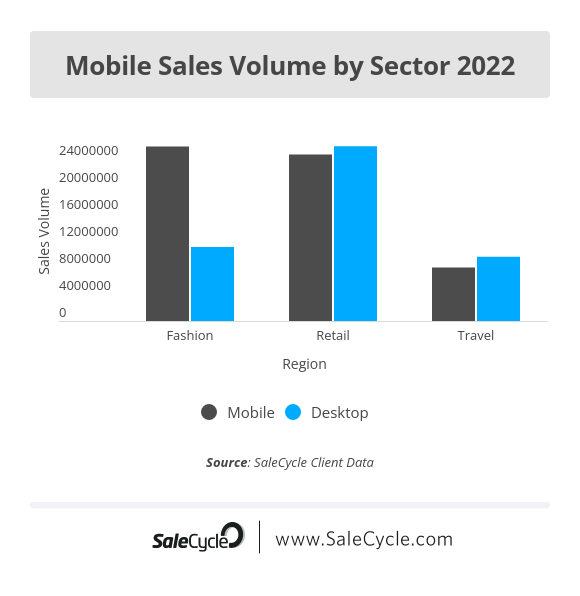
Mobile Sales by Sector
Being aware of the differences between your mobile and desktop audience can help you discover new strategies and improve old ones – especially when you can hone in on your specific sector and its common trends.
For example, when it comes to online Travel industry trends we can see that the complexity of the online buying/ booking journey is much more adaptable to desktop. This could be due to the higher AOV.
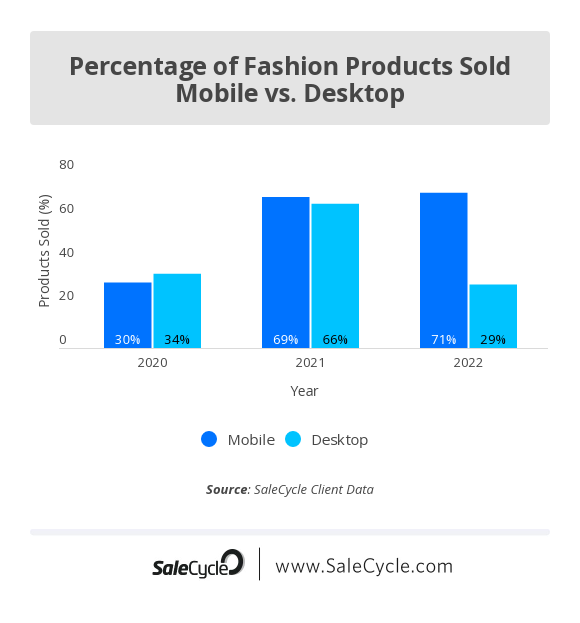
Mobile Ecommerce in Fashion
As Mobile technology becomes more advanced and accessible heading into 2023 and beyond, we see that Mobile sales produce greater numbers compared to Desktop.
In online Fashion retail in particular, mobile commerce is driving the industry. Being available on smartphones not only helps fashion brands reach a wider audience but also builds brand awareness and recognition. Fashion consumers expect a premier mobile buying experience (especially luxury products) due to clear popularity, so if you’re planning on running a successful fashion ecommerce brand you can’t afford to ignore mobile.
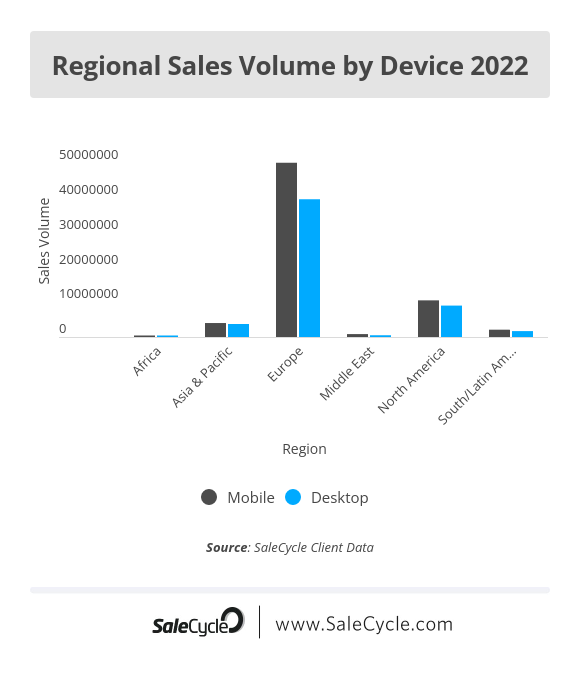
Mobile Sales Volume by Region
As we can gather here, mobile leads online sales in all regions. The growth and emergence of mcommerce within countries in areas such as the Middle East have had a big impact on global consumer behaviour.
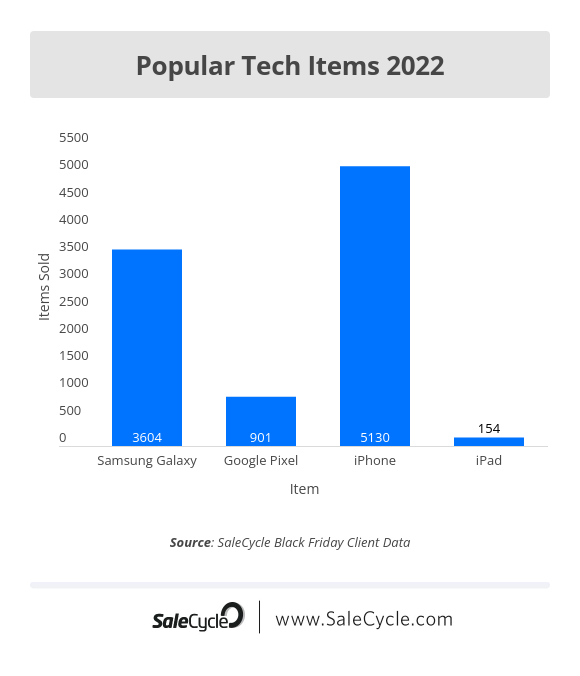
Smartphone vs Android
Black Friday holds the opportunity for consumers to grab hold of discounts in sectors with typically high AOVs – such as the Technology sector.
During Black Friday 2022, our client data concluded that the iPhone was the most popular mobile phone according to online sales, followed by the Samsung Galaxy. Although Apple sees a vast and growing number of sales year upon year, Android technology is slowly but surely becoming a more popular choice among tech consumers.
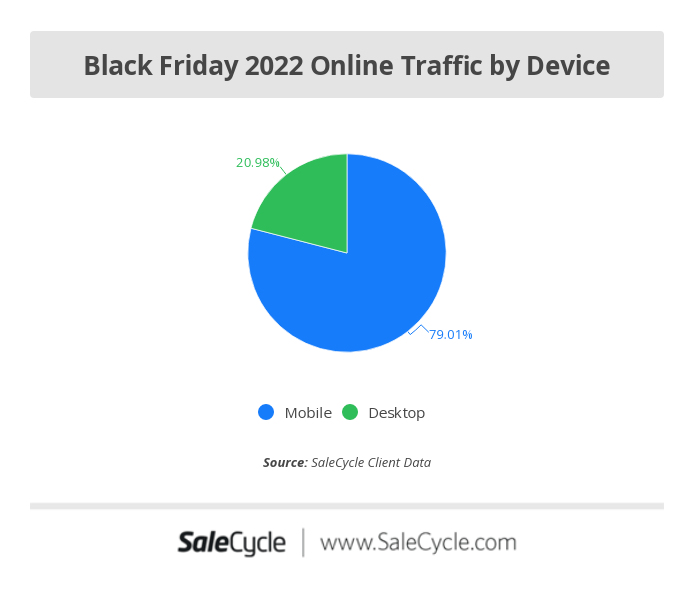
Black Friday Mobile Commerce
Black Friday has become more of a mobile shopping event, and the last event saw that the vast majority of traffic to ecommerce sites came from smartphones – a little over 79%.
Brands have the opportunity to offer special in-app purchases to add further anticipation to the Black Friday event and drive users to carry out more purchases using their mobile devices.
NEW EBOOK
⬛️ 2023 Black Friday Ecommerce Strategy & Stats Report
This FREE ebook gives you the methods, solutions & trends for building a high-converting remarketing strategy for Black Friday

Speak to an expert
Learn how to convert your online audience into revenue with our experts.

Brad Ward
Brad Ward is the SEO & Content Manager at SaleCycle. Brad is a former magazine journalist with over 8 years experience in digital, including SEO, social media and copywriting. Brad has written thousands of articles for a range of different sectors including online gambling, travel, education, sports and ecommerce.

![What Is A Good Conversion Rate? [Stats By Industry]](https://www.salecycle.com/wp-content/uploads/2017/10/Why-a-Structured-Approach-to-Conversion-Rate-Optimization-Is-Crucial.jpg)


![What Is Purchase Behaviour Segmentation? [With Examples]](https://www.salecycle.com/wp-content/uploads/2020/03/customerbehaviour.png)