
SHARE


Some of the most important metrics for retailers to track on Google Analytics, from traffic numbers to cart abandonment.
Google Analytics is a valuable tool for monitoring a range of metrics which help you to understand more about your website’s performance, visitor behaviour, and revenues.
Here are some of the key metrics to track, which will help you to gain a wider view of website performance.
What is Google Analytics?
First of all, it’s wise to get a full understanding of the platform in question – so what is Google Analytics?
Google itself describes Google Analytics as “a web analytics service offered by Google that tracks and reports website traffic, currently as a platform inside the Google Marketing Platform brand.”
As a web analytics tool, Google Analytics provides statistics and data to be used to track search engine optimisation (SEO), across the vast majority of your marketing platforms – all in one place. Google Analytics overall can give you a deeper understanding of your customers by evaluating the performance of your content, marketing, campaigns, products and more.
You can also use Google Analytics to help your organisation discover patterns and trends in user engagement and obtain other useful visitor information, such as demographics.
…and all of this is provided by Google for free.
Why Is Google Analytics Important?
Whether you have an ecommerce site or an informational site, you want to understand the behaviour of your visitors to deliver the best possible results, equalling to better conversion rates.
Google Analytics is one of the top appliances out there for monitoring and analysing traffic across any website. You are able to easily access data by working with the platform, for a seamless workflow that saves you time and increases efficiency.
All of the information gained via Google Analytics can be reworked to your advantage, so that you can eventually generate larger amounts of profitable traffic.
Why Should Retailers Use Google Analytics?
Google Analytics is an extremely valuable tool for retailers because of a simple fact – ecommerce thrives on data. In order for retailers to be able to sell to their audience, details such as revenue, demographics (e.g. the gender and age of the potential target), and visitor behaviour can all be analysed through Google Analytics, to use as predictive data so that you can develop new strategies to help you continue to drive revenue.

What Are Metrics In Google Analytics?
There are hundreds of metrics and dimensions available in Google Analytics. These are made up of quantitative measurements of data and show how your website is performing in relation to a specific division.
These accumulations of data are shown as graphs, charts, or purely numbers, across the volumes of the data you’d like to analyse. All of these elements are easily accessible and extremely simple to view when visiting your Google Analytics dashboard.
What Are The Most Important Metrics On Google Analytics?
Google Analytics is ever-evolving in its reporting capabilities, however familiarising yourself with certain metrics can be crucial to track to identify opportunities, strengths and weaknesses on your site.
Some of the most important metrics on Google Analytics used by websites of all departments include:
📈 Number of users: The number of unique/ individual visitors to your website.
📈 Sessions: This is the volume of visits to your website.
📈 Average Session Duration: Your customers engagement, measured by the average amount of time users spend on your website.
📈 Average Pages Per Session: Or Page Views, which counts the total number of pages viewed on your website per session or visit.
📈 Entrances and Exit Rates: Measures the entrance points (i.e. your homepage, pricing page, etc.) used by visitors, as well as the rate at which visitors leave your website from specific pages.
📈 Bounce Rate: A measurement of the percentage of sessions (or visitors) that leave your website without taking any additional action.
How To Check Blog Traffic On Google Analytics?
It isn’t all about traffic volumes, as attracting the right kinds of visitors (those with an intent to purchase) is more important than just numbers.
However, user numbers still provide a useful snapshot of site performance, allowing you to track trends over time.
You can track response to campaigns or new product launches to see if they drive up visitor numbers, or identify possible issues thanks to spotting dips in traffic.
It’s easy to track. Simply select ‘audience overview’ and a date range and you’ll see the headline numbers for this metric. For greater insight, add segments such as new users, or filter by country or device to see how traffic trends vary.

Looking at the audience overview, there are a few different traffic stats. It helps to understand the difference:
- Users refers to the number of visitors to your site.
- Sessions refer to site visits from users.
- Page Views refer to a page being loaded or reloaded in a visitor’s web browser.
All of these stats can be helpful in different ways. The number of users or sessions helps to give an idea of traffic numbers, while pageview counts can indicate how many pages people are viewing.
Acquisition Channels
Looking at the ‘Acquisition’ tab, you can find valuable information on where your site traffic is coming from.
This can be used to find the best sources of acquisition by volume and effectiveness, allowing you to see how different campaigns can move the needle.
Google Analytics breaks acquisition into six different channels on most accounts (the screenshot shows ‘affiliates’ and ‘display’ as it’s a Google demo account).
• Organic search. This shows natural (not paid) traffic from Google and other search engines.
• Direct. This is traffic with no referrer data. This could be visitors who have typed you URL straight into their browser, or clicked on a saved bookmark. In practice, direct traffic can come from a range of sources. For example, it may be wrongly attributed traffic from search, emails clicks where tracking hasn’t been set up,
• Referral. This traffic arrives via links outside of search engines. Visitors in this category may have clicked a link from a blog or news article for example.
• Social. This is any traffic which arrives from the various social media platforms.
• Paid Search. This is search traffic from PPC ads on Google, Bing or other search engines.

This report allows you to quickly see how your visitors arrive. Ideally, sites would have a good mix of traffic from a variety of source, so that one single source isn’t too important.
For example, an over-reliance on search traffic can mean your site performance is vulnerable to Google search algorithm changes.
In most cases, it’s likely that two or three channels will dominate, most often organic, email and direct/referrals.
This report allows you to monitor trends and track changes, see how effective marketing campaigns are, or identify areas for improvement.
For example, if organic search traffic isn’t converting as well as that from other channels, perhaps this can be improved through better product page design.
Conversion Rates
Conversion rates can tell you how well your site is converting visitors, it’s simply the number of sales divided by the number of visits.
It’s a useful benchmark which allows you to see how well your site persuades visitors to convert, or how changes you make or campaigns you run affect this number.

It’s important to note that overall site conversion rate, though it may be a useful stat, isn’t the only way to look at site performance, as Dan Barker explains here.
It can be more useful to look at conversion rates for individual channels, from particular traffic sources, or to look at individual landing page performance.
Bounce Rates
‘Bounce Rate’ tells you the percentage of users that visited a page on your site but left without clicking another page. All bounces are therefore one-page visits.
A good bounce rate will depend on the type of page and its goals. For example, if you have a high bounce rate on a ‘contact us’ page, this may simply indicate that the user has found the information they came for (a contact number perhaps) and left happy.
In some areas of the site, such as home pages or landing pages, high bounce rates can suggest a problem which needs addressing.
You can view bounce rates across several reports in Google Analytics, including audience overviews and reports on browsers and devices.

Review Device Data
Device data allows you to view patterns of use and behavior according to the devices that people are using to access the site.
You can see an overview of the split between desktop, mobile and tablet usage, which is good for viewing trends, but also seeing how performance differs between these users.
For example, the report shown below details higher bounce rates and lower conversion rates from mobile and tablet users, which could indicate a need to optimise for mobile visitors more effectively.

You can also dive into device data in more detail, to view performance by specific mobile devices.
Again, this can reveal areas to look into. If Google Pixel users have higher bounce rates than iPhone users, does this indicate a problem?
How To Find The Most Popular Pages In Google Analytics?
Under the behavior / site content section, you can view the most popular pages on your site.

This basically tells you which pages are the most popular on your site. For ecommerce sites, this is likely to tell you about the most popular products.
Review Transactions
If you head to Conversions > Ecommerce > Overview, you’ll see a summary of transactions for the time period you’ve selected.
By looking into transaction data and finding patterns, you can extract plenty of value from this data.
It can help to add segments to view the transaction data in different ways, or to compare patterns based on different time periods.
For example, some days of the week or month may generate more sales, which may prompt you to look at strategies to increase sales in slower periods.
View Cart Abandonment
Cart abandonment data can be viewed under conversions > shopping behaviour.
Head there and you’ll see this funnel visualisation which shows sessions where users view products, add items to basket, and head to checkout.
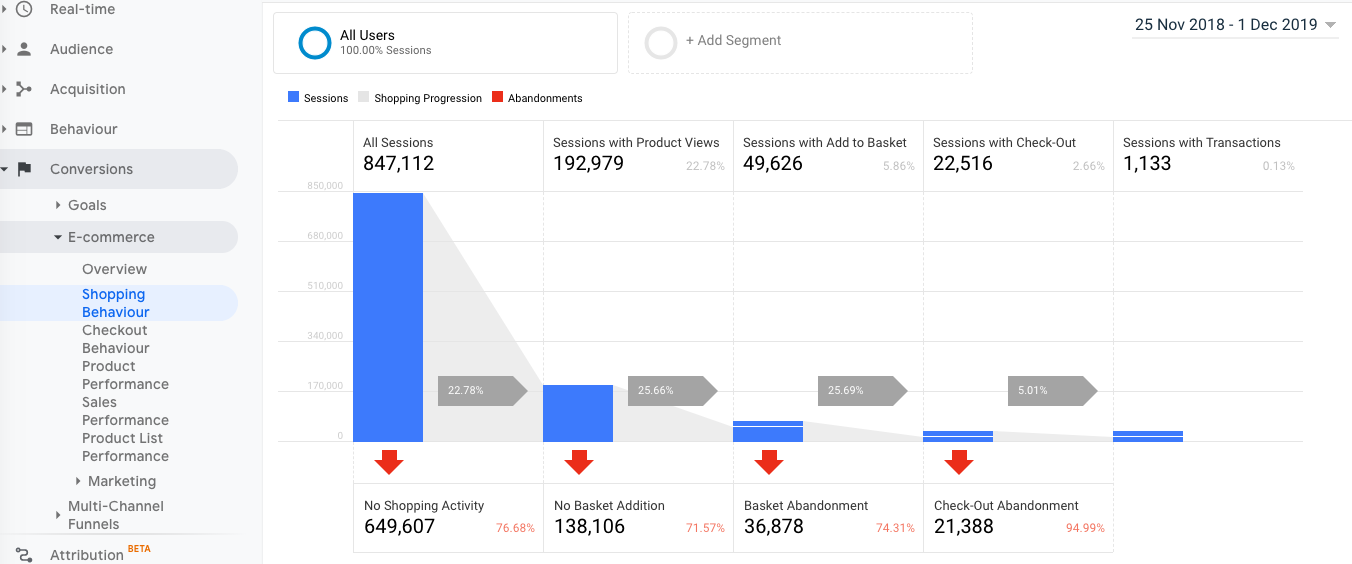
As with many Google Analytics reports or metrics, they can become especially useful when viewed in different ways. For example, you can view abandonments by device, browser, acquisition channel and more.
NEW EBOOK
⬛️ 2023 Black Friday Ecommerce Strategy & Stats Report
This FREE ebook gives you the methods, solutions & trends for building a high-converting remarketing strategy for Black Friday

Speak to an expert
Learn how to convert your online audience into revenue with our experts.

Casey Turnbull
Casey is a Fashion Journalism graduate & ecommerce marketing executive at SaleCycle. Casey is committed to producing high quality content backed by in-depth research and data. She has experience developing content in a range of sectors including fashion, ecommerce and sports.


![Valentine’s Day Ecommerce Tips and Trends [2024 Strategy]](https://www.salecycle.com/wp-content/uploads/2019/01/valentines-ecommerce-1.png)


![How SaleCycle helped Vodafone increase their online sales by an additional 2,000 additional sales per month [Extended Version]](https://www.salecycle.com/wp-content/uploads/2023/08/vodafone-banner.webp)