Products
Intelligence Centre
Data Engine
Identify and unify every visitor signal.
Decision Anyalytics
Turn behaviour into a prioritised CRO roadmap.
Activation Suite
Customer Journey Optimisation
Test and optimise every step, no dev needed.
Customer Journey Personalisation
A unique experience for every visitor.
Customer Engagement
(Onsite)
Nudge visitors at exactly the right moment.
Multichannel Remarketing
(Offsite)
Bring visitors back by email, SMS, WhatsApp & RCS.
Solutions
Industry
Luxury
From high hashion to homeware, we have you covered
Travel
Benefit from our years of knowledge
Retail
Secure those abandoned bookings
Real Estate
Keep purchasers on track, all the way to checkout
Fashion
Keep purchasers on track, all the way to checkout
Use Case
UI Activation Layer
Discover our foundational principles
Traffic Monetisation
Increase onsite conversions using SaleCycle AI technology
Cart recovery
Grow your lists, reach far and wide
Stock / price alerts
Our tech will boost your AOV, with proven results
Team
E-Commerce
We have all your needs covered
Digital
Martech is our power, book a demo to learn why
Merchandising
Let us help you boost revenue through muliple channels
Engineering
Grow with us, aqcuire new revenur genetating customers
Customers
Resources
Log in
Login
Book a demo
EN
en
fr
es
it
From trends, to insights
Discover key insights from our Experts
Explore our articles from industry news to key insights and tips to supercharge your ecommerce strategy.
Discover why we have brought BEYABLE into the SaleCycle Family
Discover more >
July 2, 2026
SMS Marketing Guide for UK and EU Businesses: Explore the Best Platforms, Tools and Strategies
Read More
July 2, 2026
WhatsApp Marketing Guide for UK and EU Businesses: Strategies, Software, Automation and Best Practices
Read More
July 2, 2026
RCS Messaging for UK and EU Businesses: What It Is, How It Works, Benefits, Marketing Use Cases and Best Tools
Read More
July 2, 2026
Email Marketing Explained: Best Platforms, Services, and Automation Tools for UK and European Businesses
Read More
July 2, 2026
How to Track User Behaviour, Activity and Customer Journeys on UK and EU Ecommerce Websites
Read More
July 2, 2026
AI Customer Segmentation: Transforming UK and EU Marketing with Personalised Insights and Tools
Read More
December 12, 2025
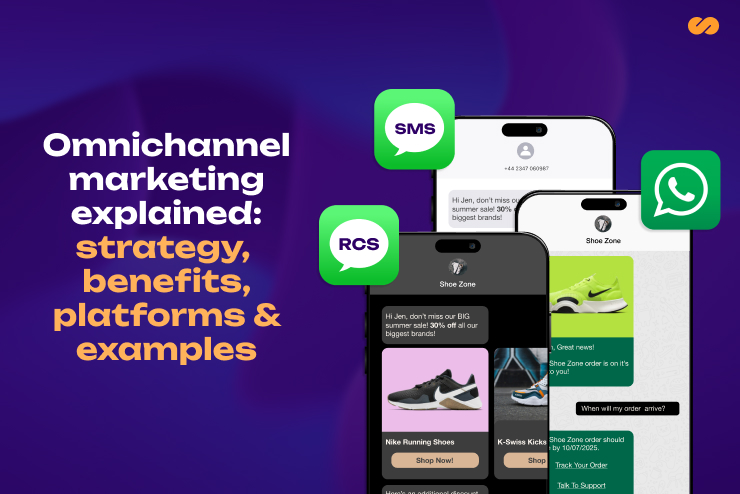
Omnichannel Marketing Explained: Strategy, Benefits, Platforms and Examples
Read More
December 12, 2025
The Complete Guide to Customer Data Platforms: How UK and European Businesses Collect, Segment, and Activate Customer Data Responsibly
Read More
December 12, 2025
Conversion Rate Optimisation for UK and EU eCommerce: Guide to the Best CRO Services and Strategy
Read More
Next