
SHARE


Average order value (AOV) is a useful measure of how much shoppers are spending on your site.
It’s a useful KPI for tracking customer behaviour, to identify different customer segments according to spend, or perhaps to see which channels are most effective in terms of revenue.
Average order value is a simple calculation: the amount of revenue generated divided by the number of orders received. So, if you generated £40,000 in sales from 400 orders, the AOV would be £100.
Average order values do not necessarily correspond with sales volumes. Sometimes AOVs are lower in busy sales periods, with the volume of orders bringing down the average.
In 2019, the highest average order values were in January, while the biggest months in terms of sales volumes were November and December (see chart below).

Average order values (AOV) vary by industry, channel and device.
The chart below shows AOV data from our 2020 Ecommerce Stats Report. As you’d expect, AOVs are highest in travel, since these are generally higher value purchases.
There’s a big drop off for travel on mobile though. As previous data has shown, travel shoppers are less likely to convert on mobile than other sectors.
The lower AOVs probably reflect the fact that people are more likely to book travel products such as hotels on mobile, which are generally lower ticket purchases than flights and holidays.
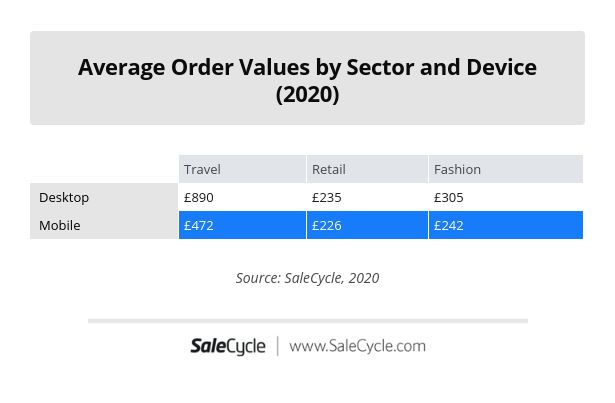
For retail and fashion, people are still spending more on desktop, but the gap between desktop and mobile is closer.
What Can Retailers do to Increase AOV?
There are a number of tactics to increase average order values, including:
- Free shipping thresholds. If people have to spend a certain amount for free shipping, or extras like next day delivery, they’re incentivised to add more to their carts.
- Promotions. Promotions can push customers towards a purchase and encourage them to add more products while offers are active.
- Product bundles. Grouping relevant products together in bundles, such as cameras with batteries or memory cards, can encourage people to buy more.
- Credit options. Buy now, pay later and more convenient payment options can encourage customers to add extra items to their baskets.
- Added extras. Extras such as product insurance, extended guarantees, or gift-wrapping can help to drive up order values.
The State of Average Order Value (AOV) By Industry
Using digital marketing examples from ecommerce experts we analyse the best way to increase average order value on mobile. However, these tips can also be transferred over to desktop as well.
Recent stats and trends from SaleCycle 2020 client data found the total mobile add-to-cart rates were up 2.48% from 2019. However, in more mature markets like the UK, add-to-cart rates increase by over 10%. Although add-to-cart rates have increased on mobile the average order value (AOV) is still higher on desktop, but we can comfortably say that this is getting better as ecommerce conversion rate optimisation improves. SaleCycle explores what CRO is in another article.
Our 2020 research found average order value (AOV) in mobile baskets was less than desktop baskets in 3 key sectors: retail, fashion and travel.
AOV trends by device (see table above) allows us to examine the data, which shows us that consumers are more comfortable buying high-ticket items on desktop over mobile. We can draw conclusions here that travel is the denominator with retail just leaning towards desktop. The fashion industry is split into consumer and luxury, with luxury fashion tipping the scales in favour of desktop.
Tips To Increase Average Order Value (AOV) On Mobile & Desktop
Indeed, Schuh’s Stuart McMillan has seen a long-term increase in average order values on mobile, thanks to a focus on the mobile user experience which goes back several years.
SaleCycle interviewed Stuart, Deputy Head of Ecommerce at Schuh and James Gurd, an ecommerce consultant and owner of Digital Juggler how they would seek to increase average order value (AOV). Of course, many of these tips apply equally to desktop and mobile ecommerce, but retailers can tailor these tactics, such as the way promotions are displayed, for the mobile shopper.
User Experience (UX) & User Interface (UI)
An improved mobile user experience can help to explain increased mobile sales, but it doesn’t explain why average order values may be lagging behind. However, it underpins the performance of a site, and contributes to improved sales performance indirectly, as James Gurd explains: “There are many factors that contribute towards increasing basket size. Service and UX quality improve customer satisfaction, but alone don’t guarantee an AOV increase. Just because I’m happy with your website doesn’t mean I’ve got more money to spend.”
People make quick judgements about a site when they arrive, and they’ll be less likely to buy if a site doesn’t look the part. People will expect different design standards depending on the brand and product, but if you’re looking to sell more expensive items, then the site needs to use imagery and design to provide that luxury feel.

Stuart McMillan says:“customers are also less likely to buy expensive products off a cheap site! The look and feel of a site has a strong influence over the perceptual “value” of the site and the products. Anything that creates a positive brand perception (which can even include things like site speed) will improve your ability to sell more expensive products.”
Free Shipping
Free shipping can help to drive sales when offered as standard, but can specifically help to increase average order value (AOV) when offered as a carrot to customers who spend a little bit more. A UPS study found that 58% of shoppers had added extra items to their cart to qualify for free delivery. A research study by Statista in 2020 found high shipping costs was the primary reason for cart abandonment at 63%. It’s important to display your delivery offer clearly, so customers are aware and have a chance to add more items to reach the free shipping threshold, as Lego does here:

Promotions & Product Recommendations
As James Gurd explains, “tactics like promotions and product recommendations have a proven direct impact on average order value (AOV) as they directly influence basket behaviour.” In this example from Rakuten, a site-wide promo code is shown on product pages. This can push customers towards a purchase and encourage them to add more products while there is a discount.

Merchandising
Merchandising is the science (or art) of displaying products on-site to maximise sales. It covers the choice of products to show in homepages, on category pages, and so on.
James Gurd: “Merchandising is important. Testing ways to change the products that are shown based on individual users can influence add to basket behaviour. For example, sites could showcase brands with higher ticket items to measure impact on KPIs like conversion rate and AOV.”
Cross and Up-Selling
Smart cross-selling and upselling recommendations on product pages, shopping carts and during checkout can encourage customers to add more items to their carts.
Some of these products may be obvious, such as recommending memory cards when people buy cameras, or related accessories to complete the look on fashion sites, as J Crew does:

Avoid ‘Buyer’s Remorse’
Buyer’s remorse refers to the concerns that customers may have after placing an order. For example, if there were a lot of products to choose from, it’s natural for shoppers to wonder whether they made the right decision. This can lead to higher ecommerce returns rates.
According to Schuh’s Stuart McMillan, speedy delivery can help to address this problem: “Buyer’s remorse may be more apparent on a more expensive product, and a good way of reducing this is to get the product to the consumer as quick as possible so they can get using it before they have a chance to regret it.”
Bundling Products Together
Bundling encourages shoppers to add more items to their orders, perhaps to receive discounts or to buy complementary products. This could include 3 for 2 offers, or preferential pricing on multi-buys, as Currys offers here:

Provide Credit Options
Our data consistently tells us that high value items like holidays, electronics, and luxury goods are abandoned multiple times by the same shopper. Adding a ‘buy now and pay later’ and more convenient payment options can encourage customers to first of all make a purchase, but also to add more to their baskets.

Providing Extra Services
Extras like product insurance, extended guarantees, or gift-wrapping can help to increase order values. Here’s a great example from IKEA. Customers are asked just before payment if they’d like to have the items assembled on site. This can save the customer a lot of potential hassle, and makes the order more valuable for the retailer.

Price Adjacency
As Stuart McMillan advises, cheaper products shouldn’t be put before expensive products, as ‘customers will be anchored on the lower price’. Anchoring is a cognitive bias in decision making which refers to the human tendency to rely on the first piece of information offered when making a decision. It has relevance in many situations, but the smarter online retailers will be aware of this and use it to their advantage.

For example, when choosing from a restaurant wine list, diners will often order the second cheapest as they don’t want to appear to be tight-fisted, but they don’t want to spend too much either. So in this case, the cheapest price acts as an anchor, as do the more expensive bottles.
Indeed, restaurants understand this customer behaviour and are said to price the cheapest wine (for them) second on the list, as they make more profit from selling those. Another method is to show what the current price was reduced from, so customers anchor on the higher price and see greater value in the product.

For more data on AOV and sales trends, along with a wealth of other data on ecommerce, download our 2020 Ecommerce Stats Report.

Reviewed by Brad Ward
Written by Graham Charlton
— Updated on 15/03/2021
NEW EBOOK
⬛️ 2023 Black Friday Ecommerce Strategy & Stats Report
This FREE ebook gives you the methods, solutions & trends for building a high-converting remarketing strategy for Black Friday

Speak to an expert
Learn how to convert your online audience into revenue with our experts.

Graham Charlton
Graham Charlton is Editor in Chief at SaleCycle. He's been covering ecommerce and digital marketing for more than a decade, having previously written reports and articles for Econsultancy. ClickZ, Search Engine Watch and more.

![What Is A Good Conversion Rate? [Stats By Industry]](https://www.salecycle.com/wp-content/uploads/2017/10/Why-a-Structured-Approach-to-Conversion-Rate-Optimization-Is-Crucial.jpg)