SHARE


During 2022 SaleCycle witnessed more than 1,689,953,291 user journeys in the online fashion market from 150 of the world’s biggest and most prestigious fashion ecommerce brands.
Download 2023 Fashion Ecommerce Stats & Trends Report
We’ve compiled a list of online clothing shopping statistics in the fashion market. These fashion ecommerce statistics include online traffic, cart abandonment, average order value statistics and much more.
Understanding key online fashion statistics will help you analyse your own fashion marketing performance while also being able to benchmark success of your campaigns. For example understanding the best days for ecommerce sales allows for much more effective and targeted campaigns towards higher intent buying.
Below we take a look at some key statistics from the biggest fashion ecommerce sites.
Fashion Ecommerce Statistics in 2022/23 – A Market Overview
When it comes to Fashion Ecommerce there are clear signs – according to the data from our 2023 Fashion Ecommerce Stats & Trends Report – that the demand for clothing, accessories and other fashion items is on the rise. In fact, despite the current economic situation – including the cost of living crisis and ecommerce post covid – it has been widely reported that although the global online fashion market was worth a huge $533 billion in 2018, it is predicted to grow to a staggering $872 billion by this year (Statista).
Fashion purchasing has changed vastly during these times. Almost two decades on from the release of the first iPhone, mobile shopping is a standard part of fashion ecommerce models. We have seen the effects of fashion ecommerce taking place with high street closures of clothing stores including TopShop, Debenhams, Oasis and Warehouse – being taken over by better performing fashion retail mobile apps, e.g. ASOS.
When looking at our data, it can be argued that advances in mobile technology along with a new generation of tech-savvy consumers has been playing a massive role in the world of ecommerce – particularly in fashion. This means that the world of ecommerce has more opportunities than ever before to make a significant impact on their customer base.
Fashion brands are becoming more aware of convenience and accessibility, as well as ecommerce fashion trends, thanks to the increasing availability of shopping technology. With online shopping becoming a typical part of consumerism, especially in fashion, brands will need to adapt their strategies and offerings to meet the evolving needs of customers.
As well as recognising positive advances in the ongoing ecommerce climate, this report highlights both the challenges and the opportunities within the fashion sector for your current and upcoming ecommerce fashion campaigns.
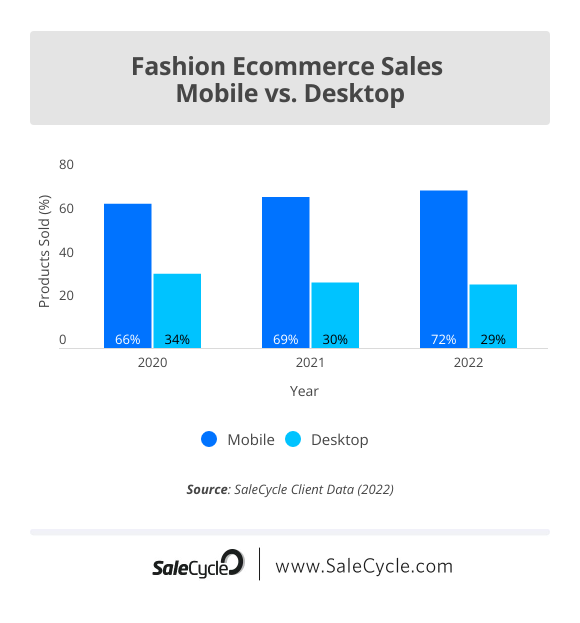
Ecommerce Fashion Industry Stats by Device – Mobile vs. Desktop
We have gathered from our reports that mobile traffic in the fashion sector is on the rise, accumulating in over half of all internet traffic.
When we look further into these traffic numbers, we can see that all fashion categories – outerwear, everyday apparel, and activewear – are bought primarily via mobile devices across the board by a significant amount, making up over 72% of sales compared to desktop, with just over 28% of all online sales.
Retail faces a whole new generation of online consumers who use smartphones as their main mode of shopping. Ecommerce payment methods (or online cashless payments), along with simple one-touch functions such as adding to your ‘wishlist’ or using ‘save for later’ buttons, means that online fashion brands are getting better and better at replicating a real-life browsing experience without the hassle of leaving the home.
This, combined with the typically younger demographic of the fashion industry, means that fashion consumers are much more reliant on digital devices now more than ever, and as mobile technology becomes more advanced and accessible in 2023, and beyond, we see that mobile sales produce greater numbers compared to desktop.
Encouraging your consumers to browse and buy via desktop can be challenging in the fashion sector. When we begin to break down and analyse standard customer behaviours according to stats, it’s clear that people are more likely to purchase via desktop when the item has a higher average order value (AOV) and are more complex – in this case, clothing can be seen as more of a nonessential grade of ecommerce (compared to online travel industry trends or homeware goods sectors where mobile vs desktop conversion rates are more in favour of desktop).
Recognising that fashion buyers prefer mobile shopping is key, however there are certain ways to allow your customers to browse and buy via both platforms (mobile and desktop). Optimising each platform with similar functions and layouts to coordinate for a complete brand presence can help encourage more sales across the board, for a smooth and more usable customer experience.
The Effects Of Seasonality In The Fashion Industry
What Is Seasonality In Fashion Ecommerce?
Through this report, it’s clear that seasonality in fashion dictates the impact of sales and activity within fashion ecommerce. Seasonality in fashion refers to the cyclical changes in consumer preferences for certain styles, colours, fabrics, and patterns based on the time of year. Fashion trends are heavily influenced by the seasons, as clothing needs change with the weather and holidays.
Ecommerce marketers can relate this social proof examples, when consumers follow certain patterns and behaviours based on visual and communicative preferences – you can discover more about social proof when carrying out A/B testing.
What Months Are Best for Ecommerce Sales?
November is recognised by ecommerce as the yearly peak for online shopping and sales thanks to events such as Black Friday, Singles Day and the run-up to the holiday season, and we have found that this follows suit in this year’s report.
However in the fashion industry, we expect to see peaks in sales around months (or seasons) that are appropriate for each individual item of clothing, and following seasonal releases from brand designers.
What Is an Example of Seasonality?
We can see that seasonality comes into play when we look at an example of a clothing item from the report – shorts. Shorts prove to be bought throughout most of the year, but especially in the summer months, peaking in June with 220,292 pairs purchased. But in December, shorts sales decreased by over 89%.
As we have found, fashion items including T-shirts, dresses, jumpers and jeans are the most popular items and stay at similar sales volume throughout the year. We can consider these garments as non-seasonal, as they hold the ability to be worn throughout the year thanks to different styles and trends provided by fashion brands.
Fashion ecommerce platforms need to adjust their marketing strategies to align with seasonal trends. Creating urgency in sales with relevant and engaging content (aligned with customers’ changing preferences) is paramount in order to encourage successful seasonal deals and new releases – something to keep in mind when producing email campaigns, ecommerce newsletter, and targeted promotions.
Take a look at these abandoned cart codes ideas for some inspiration.
Ecommerce brands can also benefit from optimising the user experience and customer journey to avoid browse abandonment. This can involve prominently featuring seasonal products on the homepage, organising products by season, and promoting seasonal deals.It’s also important to take seasonality into consideration when determining how to organise stock level throughout the year, and when to utilise sales in order to get rid of unwanted stock build-up.
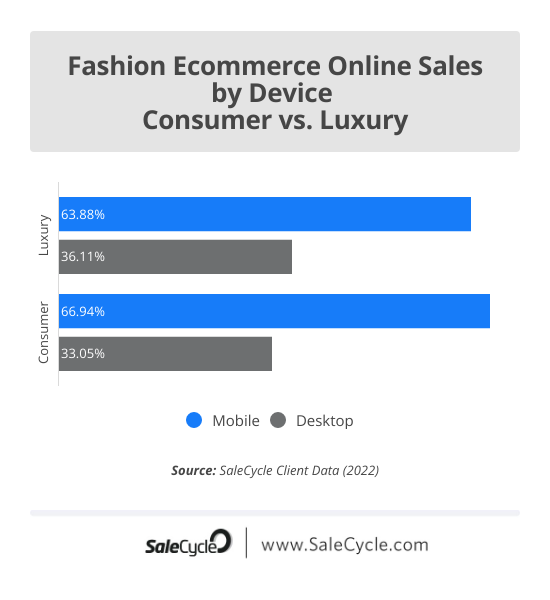
Consumer Vs. Luxury Fashion Market Buying Habits
No matter what the item or the cost, price is an important defining feature when it comes to consumer vs. luxury fashion items.
When it comes to market sizes, consumer fashion brands often have a larger online presence than luxury fashion brands. This is because consumer fashion brands are typically more accessible to the average consumer with lower prices and promo codes.
When it comes to luxury fashion, brands target a more affluent audience and construct marketing around exclusivity, rarity and quality. Higher priced products are justified with these added features and/or novelties.
Consumer sales took up 85.21% of sales in our most recent findings. This buying behaviour backs up that consumers tend to purchase more non-luxury fashion products online.
We have also found that although both consumer and luxury fashion brand buyers are much more likely to purchase using a mobile phone, more luxury items are bought via desktop when compared to consumer desktop sales.
With these polar differences in price in the fashion sector, there are certain consumer behaviours that come into play when shopping online.
Understanding these buying attitudes and customer behaviour prediction is essential to the success of any conversion effort.Luxury brands should invest in user-friendly mobile form design and interfaces to enhance the shopping experience for consumers, as they represent a significant proportion of online fashion shoppers for both sectors.
Online Traffic Trends In Clothes Shopping
In order to aim in the correct direction to capture as many sales as possible, ecommerce brands should firstly direct their focus on better understanding the behaviours and actions of their customers. By investigating online traffic against all of the other factors within a certain time period, including abandonment levels, we can gauge intent levels of users throughout the year. This can be utilised to get you the best conversions going forwards.
What Month Do People Buy The Most Clothes?
The traffic volume trend for fashion ecommerce throughout the year shows that there is a decrease in activity from January to August, but then an increase in traffic from September to December. This may be influenced by various factors, including: seasonal changes, holidays, and the marketing campaigns that follow – for example, Black Friday and Cyber Monday sales.
We see this in the months leading up to November and December with a significant increase in traffic volume, which translates to higher online sales for fashion ecommerce brands.
Brands should be aware of these traffic volume trends and their potential impact on online sales to be able to tailor marketing and sales strategies accordingly, leveraging the increased traffic and sales potential during the holiday season and finding ways to boost sales during the slower months.
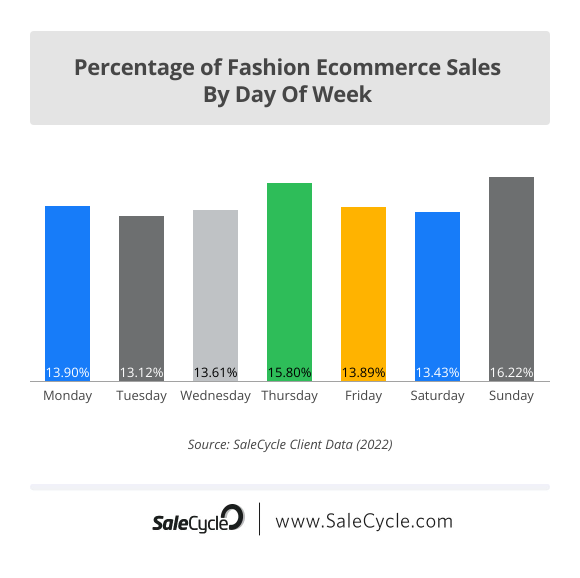
What Is The Most Popular Shopping Day?
According to this year’s findings, Sunday is the most popular day of the week to purchase a fashion item. We can gather that when it comes to clothing and outfits, customers want to purchase their items during a period of downtime – which typically occurs on a Sunday for the majority of western lifestyles.
This is supported by the fact that Tuesday was found to be the least popular day to purchase in the fashion sector, aiding the theory that most consumers are preoccupied during the week.
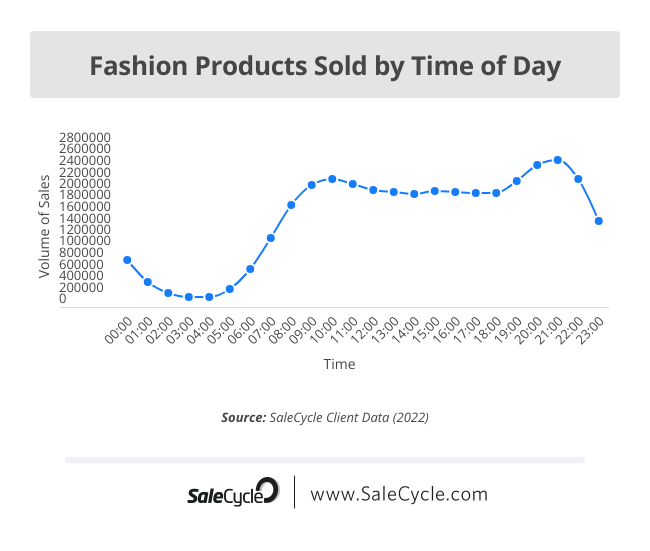
We have also found that when it comes to time of day, there is a slow gradual growth in sales throughout daylight hours, leading to an initial peak in sales at 9am. This peak steadily decreases until the greatest peak in sales occurring at 9pm.
Looking further into behavioural patterns against the data, we can assume that the majority of sales happen later in the day due to out of work hours and/ or ‘downtime’. We can also predict that a number of sales are occuring in the earlier hours of the morning thanks to these recent mobile commerce statistics, giving consumers the chance to browse and purchase with ease.Using these predicted downtime hours and other shopping behaviours could help to coordinate ecommerce customer retention strategies in your brand’s base, leading to a significant improvement in sales.
Online Traffic Trends – By Device
Online traffic is a highly important part to consider in your ecommerce business model across all of your brands platforms. These numbers indicate the amount of potential per device with customers returning to your site, and therefore the amount of interest surrounding it.
While there are some similarities between shopping for fashion items on mobile and desktop, we have also found some significant differences in online shopping trends that brands should consider when tailoring their ecommerce platforms for the best customer experience.
We have found that out of all online traffic to fashion commerce sites this year, over 70.22% of all traffic occurred on mobile – 40.49% accounting for consumer fashion and just 7.02% for luxury fashion.
With a lower AOV combined with a device that provides browsing ease, it’s perhaps no wonder that mobile consumer fashion takes the vast majority of traffic. This is a key indicator for consumer fashion brands to capitalise on their mobile platforms – perhaps with exclusive ‘’in-app’’ sales to continue this positive trend. This is also a key indicator to finding success in selling luxury products online – brands should optimise their mobile sites to follow suit, and link desktop and mobile functions to encourage more activity.
Fashion Industry Cart Abandonment Email Trends
Email marketing in the fashion industry has gotten much more advanced over time to increase online engagement and this is largely due to personalisation. Personalised app notifications and cart abandonment emails that remind the customer of a particular item of interest or an incomplete checkout – including images of the desired item – are becoming the norm. We can only predict that these techniques will advance over time, so it is vital to harness these tactics as part of your standard fashion ecommerce strategy whether you’re in the consumer or luxury sector.
According to the 2023 report, luxury fashion holds a higher email open rate and click rate across all mature markets, with a difference of over 26%.
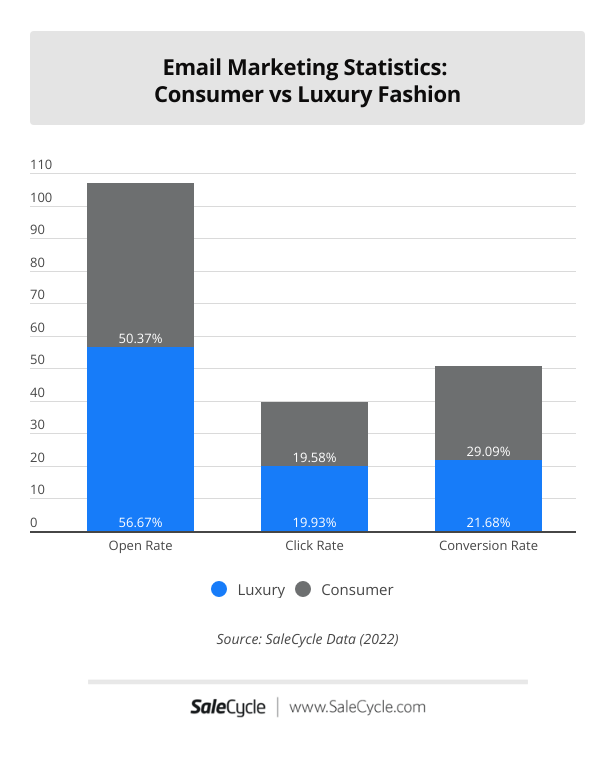
We can gather that this is because luxury brands tend to focus on much more personalised marketing tactics in order to secure that large sale. When consumers see their name (for example) connected to an exclusive or expensive item, they are more likely to investigate and open the email.
However when it comes to consumer fashion, we can see that customers are much more likely to convert to a site, meaning they are more likely to commit to completing their customer journey by carrying out a sale.
We are aware that this sector in fashion tends to offer more discounts and sale opportunities to attempt to gain more sales for a higher AOV. Customers are highly likely to take advantage of these sales opportunities, especially when a ‘’Limited Offer” or “Flash Sale” narrative is used to create a sense of urgency.
Fashion Ecommerce Statistics: Key Takeaways
Popular Times To Buy:
- January: 13.62%
- Sunday: 16.22%
- 9pm: 6.87%
Popular Items:
- Dresses: 25.89%
- T Shirts: 16.46%
- Jeans: 12.9%
Jumper/ Sweater: 11.45%
Email Marketing:
- Avg Open Rate: 53.52%
- Avg Click Rate: 19.75%
- Avg Conversion Rate: 25.47%
Online Sales:
- Mobile: 71.75%
- Desktop: 28.24%
Consumer Vs. Luxury Sales:
- Consumer: 40.49%
- Luxury: 7.02%
In recent years, and in 2023, it has been made clear that mobile technology in fashion ecommerce reigns supreme across all sectors and regions, telling us that we’re quite literally taking our individual ecommerce journey into our own hands with more efficiency.
Notifications and emails are more accessible using this mode of technology, making sales periods much more popularised. Leading on from this, we have learned that the fashion sector follows standard ecommerce sales trends as we see peaks in numbers around the summer months and during popular winter sales periods (November-December), thanks to public holidays. This is also thanks to seasonality trends in fashion, encouraging consumers to revive their wardrobes at certain times of the year.
This seasonality concept can be better utilised this year, and in the years ahead, thanks to the end of the pandemic. We have found that more outerwear/ socialising items of clothing are being sold again, seeing an end to restrictive buying habits. In last year’s report, we saw sales in loungewear and masks peak due to the needs of a pandemic lifestyle setting. This year, we see outerwear sales picking up as the demand for items to socialise becomes normal again.
How To Use Fashion Ecommerce Statistics
Online fashion retail trends and statistics make for an important platform to analyse your marketing and conversion rate optimisation plans.
For example, online fashion trends may change with advancements in technology, social proof / customer’s buying habits and user behaviour may also change and have shifted due to the impact of the global pandemic. This is why it’s always a good idea to analyse your industry data and compare fashion trends.
One of the most significant changes in recent years has been the shift from the high street to online and then from desktop to mobile. In a previous SaleCycle ecommerce report we highlighted that mobile-add-to-cart rates were high on mobile compared to the actual conversion rates. However conversion rates on mobile are certainly improving.

Reviewed by Brad Ward
Written by Casey Turnbull
— Updated on 26/07/2022
NEW EBOOK
⬛️ 2023 Black Friday Ecommerce Strategy & Stats Report
This FREE ebook gives you the methods, solutions & trends for building a high-converting remarketing strategy for Black Friday

Speak to an expert
Learn how to convert your online audience into revenue with our experts.

Casey Turnbull
Casey is a Fashion Journalism graduate & ecommerce marketing executive at SaleCycle. Casey is committed to producing high quality content backed by in-depth research and data. She has experience developing content in a range of sectors including fashion, ecommerce and sports.

![Valentine’s Day Ecommerce Tips and Trends [2024 Strategy]](https://www.salecycle.com/wp-content/uploads/2019/01/valentines-ecommerce-1.png)