SHARE


After another record-breaking Black Friday for ecommerce, we look at some of numbers. There’s stats on peak times, sales volumes and more…
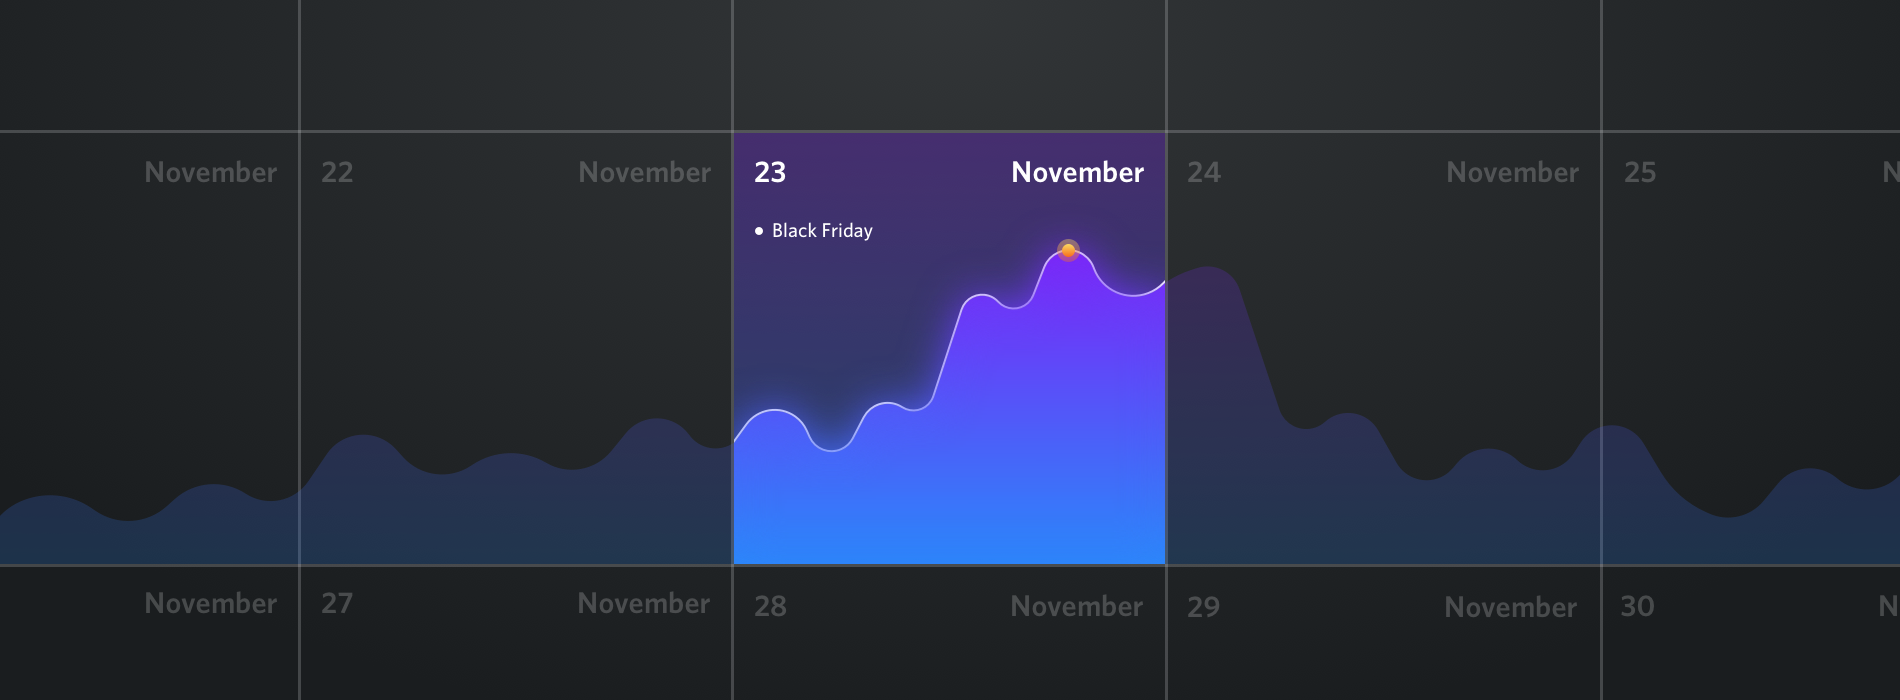
Black Friday Sales Volumes
Looking at sales volumes over November, we can see the effect that Black Friday has on ecommerce sales.
Sales are consistent throughout the month, and build up in the few days before Black Friday.
(We’ve overlayed these charts with 2017 data, adjusted to reflect the fact that Black Friday 2017 was on the 24th November. The data comes from clients in both the US and UK).

Looking more closely at the weekend, we can see that sales volumes were higher than 2017, peaking at similar times.
It’s significant that sales volumes continued to be relatively high on the Saturday after Black Friday, as well as the Tuesday after Cyber Monday. This reflects the fact that retailers continued sales over a longer period.

Black Friday Sales Values
Sales values were lower for much of November compared to 2017, but accelerate over the Black Friday weekend, reaching higher levels than in 2017.

Looking at the weekend in more detail, we see that the Saturday following Black Friday was the biggest day in terms of sales values.

US Black Friday Sales Stats
Black Friday sales reached $6.2 billion, up 23.6% on 2017’s numbers.

US Cyber Monday Sales Stats
Cyber Monday 2018 was the biggest ever online shopping day in the US, with sales reaching $7.9 billion according to Adobe data. This is 19% higher than last year’s total.

Most Popular Verticals
According to Hitwise stats, the Groceries & Alcohol and House & Garden categories enjoyed the highest year on year on Black Friday (12% and 8%, respectively).

Traffic and Conversions by Device
Adobe tracked traffic and sales by device between the 1st and 26th November. The stats suggest that customers are still happy to browse on mobile, but can be reluctant to complete purchases on smartphones.
So, mobile accounted for 49% of traffic but just 30% of sales, while desktop seems to take up the shortfall, generating 61% of all purchases from 42% of traffic volume.

Conversion rates for Cyber Monday confirm this trend. Smartphone conversion rates were 3.9%, much lower than desktop and tablet.

This suggests that retailers still need to work on optimising mobile sites for shoppers, as it seems many are still reluctant to checkout on mobile, even if they’re happy to browse.
Offline Footfall Down over Black Friday Weekend
Our consumer survey data suggested that people were more likely to shop online than head for stores, and this is the way it’s turned out.
Q: Where do you plan to do your shopping over Black Friday weekend?

According to data from Springboard (reported in the FT) high street footfall for Black Friday and the weekend was down 5% on 2017.
Shopping centres were most affected, with an annual decline in visits of 8% or more on all three days.
NEW EBOOK
⬛️ 2023 Black Friday Ecommerce Strategy & Stats Report
This FREE ebook gives you the methods, solutions & trends for building a high-converting remarketing strategy for Black Friday

Speak to an expert
Learn how to convert your online audience into revenue with our experts.

Graham Charlton
Graham Charlton is Editor in Chief at SaleCycle. He's been covering ecommerce and digital marketing for more than a decade, having previously written reports and articles for Econsultancy. ClickZ, Search Engine Watch and more.

![Valentine’s Day Ecommerce Tips and Trends [2024 Strategy]](https://www.salecycle.com/wp-content/uploads/2019/01/valentines-ecommerce-1.png)